Deck 3: Tables and Graphs for Summarizing Data
Full screen (f)
Question
Question
Question
Question
Question
Question
Question
Question
Question
Question
Question
Question
Question
Question
Question
Question
Question
Question
Question
Question
Question
Question
Question
A student counted the number of candies of each color in a bag of 57 Reese's Pieces.The results are shown in the following bar graph. 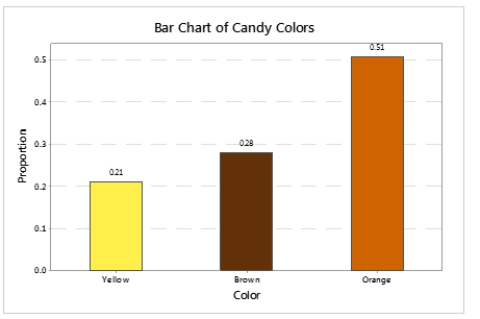 What percentage of the candies were NOT colored orange?
A) 21%
B) 28%
C) 49%
D) 51%
What percentage of the candies were NOT colored orange?A) 21%
B) 28%
C) 49%
D) 51%
Question
A student counted the number of candies of each color in a bag of 57 Reese's Pieces.The results are shown in the following bar graph. 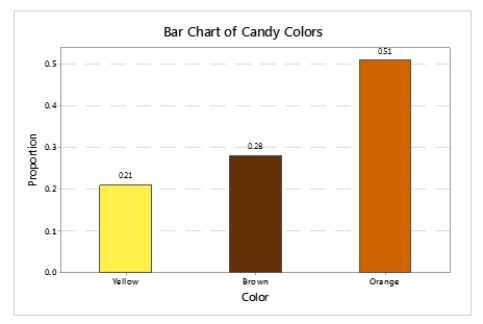 How many of the candies were colored orange?
A) 12
B) 51
C) 29
D) More information is needed to answer the question.
How many of the candies were colored orange?A) 12
B) 51
C) 29
D) More information is needed to answer the question.
Question
Question
A 2012 survey examined cell phone ownership by U.S.adults.The results of the survey are shown in the pie chart below. 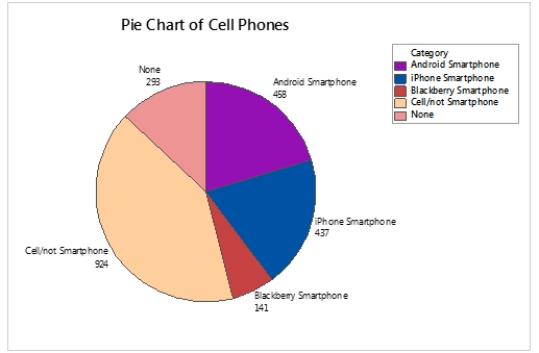 What percentage of the adults surveyed did NOT own a smartphone?
A) 13%
B) 45.9%
C) 41%
D) 54%
What percentage of the adults surveyed did NOT own a smartphone?A) 13%
B) 45.9%
C) 41%
D) 54%

Unlock Deck
Sign up to unlock the cards in this deck!
Unlock Deck
Unlock Deck
1/26
Play
Full screen (f)
Deck 3: Tables and Graphs for Summarizing Data
1
A cardiologist is studying the effects of soothing music on a person's heart rate.He records his patient's at-rest heart rate in whole beats per minute before and after they listen to soothing music.The variable "heart rate" in this study is BEST described as:
A) qualitative.
B) continuous.
C) discrete.
D) categorical.
A) qualitative.
B) continuous.
C) discrete.
D) categorical.
C
2
Relative frequency is BEST suited to describe which data type?
A) continuous
B) quantitative
C) multivariate
D) qualitative
A) continuous
B) quantitative
C) multivariate
D) qualitative
D
3
A numerical data set is _____ if the set of all possible values is finite,or countably infinite.
A) quantitative
B) discrete
C) qualitative
D) categorical
A) quantitative
B) discrete
C) qualitative
D) categorical
B
4
In order to assure prompt service,the city metro routinely records wait times at its various bus stops.The length of time a customer must wait for a bus is recorded in seconds.What type of data are these?
A) qualitative
B) discrete
C) continuous
D) multivariate
A) qualitative
B) discrete
C) continuous
D) multivariate
Unlock Deck
Unlock for access to all 26 flashcards in this deck.
Unlock Deck
k this deck
5
Concerning univariate data,a _____ or _____ data set consists of observations that are numbers.
A) categorical;qualitative
B) categorical;quantitative
C) numerical;quantitative
D) numerical;qualitative
A) categorical;qualitative
B) categorical;quantitative
C) numerical;quantitative
D) numerical;qualitative
Unlock Deck
Unlock for access to all 26 flashcards in this deck.
Unlock Deck
k this deck
6
A numeric data set is _____ if the set of all possible values is an interval of numbers.
A) continuous
B) discrete
C) qualitative
D) categorical
A) continuous
B) discrete
C) qualitative
D) categorical
Unlock Deck
Unlock for access to all 26 flashcards in this deck.
Unlock Deck
k this deck
7
If there are more than two observations on the same person,the data set is:
A) bivariate.
B) multivariate.
C) random.
D) univariate.
A) bivariate.
B) multivariate.
C) random.
D) univariate.
Unlock Deck
Unlock for access to all 26 flashcards in this deck.
Unlock Deck
k this deck
8
A data set consisting of two observations on each individual subject is a _____ data set.
A) bivariate
B) multivariate
C) random
D) univariate
A) bivariate
B) multivariate
C) random
D) univariate
Unlock Deck
Unlock for access to all 26 flashcards in this deck.
Unlock Deck
k this deck
9
Bic corporation performs routine quality control testing on its lighters.Each lighter tested is struck and the trial is recorded as either a success (the lighter ignites)or a failure (the lighter does not ignite).This is an example of what kind of data?
A) continuous
B) discrete
C) qualitative
D) quantitative
A) continuous
B) discrete
C) qualitative
D) quantitative
Unlock Deck
Unlock for access to all 26 flashcards in this deck.
Unlock Deck
k this deck
10
In a study of the effectiveness of a drug that is designed to reduce blood pressure,each individual participant has their blood pressure recorded in millimeters of mercury before and after taking the drug.Of what type is the data in this study?
A) categorical/qualitative
B) categorical/quantitative
C) numerical/quantitative
D) numerical/qualitative
A) categorical/qualitative
B) categorical/quantitative
C) numerical/quantitative
D) numerical/qualitative
Unlock Deck
Unlock for access to all 26 flashcards in this deck.
Unlock Deck
k this deck
11
The sum of all the relative frequencies of classes up to and including a particular class is defined as the:
A) relative frequency (RF).
B) boundary frequency (BF).
C) cumulative relative frequency (CRF).
D) frequency modulation (FM).
A) relative frequency (RF).
B) boundary frequency (BF).
C) cumulative relative frequency (CRF).
D) frequency modulation (FM).
Unlock Deck
Unlock for access to all 26 flashcards in this deck.
Unlock Deck
k this deck
12
Two statistics students are arguing over which type of bar graph to use.One insists that a bar graph that displays the relative frequency will be better for displaying the overall shape of the data.The other holds that only a frequency bar graph will suffice.You happen along and hear their conversation.What advice do you give them?
A) The relative frequency bar graph is superior at displaying the overall shape of the data.
B) The frequency bar graph is superior at displaying the overall shape of the data.
C) A pie chart would be needed here to display the overall shape of the data.
D) Either bar graph would suffice as they differ only in scale.The shape will be the same.
Unlock Deck
Unlock for access to all 26 flashcards in this deck.
Unlock Deck
k this deck
13
Concerning numeric data,a negatively skewed distribution has:
A) most of the data concentrated in the lower values with relatively fewer larger values.
B) most of the data concentrated in the higher values with relatively fewer lower values.
C) a positive amount of values skewed across the center.
D) an equal amount of large and small values.
A) most of the data concentrated in the lower values with relatively fewer larger values.
B) most of the data concentrated in the higher values with relatively fewer lower values.
C) a positive amount of values skewed across the center.
D) an equal amount of large and small values.
Unlock Deck
Unlock for access to all 26 flashcards in this deck.
Unlock Deck
k this deck
14
A survey records a person's smoking status as either "yes" or "no." This survey is recording what kind of data?
A) categorical/qualitative
B) categorical/quantitative
C) numerical/quantitative
D) numerical/qualitative
A) categorical/qualitative
B) categorical/quantitative
C) numerical/quantitative
D) numerical/qualitative
Unlock Deck
Unlock for access to all 26 flashcards in this deck.
Unlock Deck
k this deck
15
Concerning qualitative data,the _____ of a particular class is the count for that class.
A) relative frequency
B) distribution
C) frequency
D) probability
A) relative frequency
B) distribution
C) frequency
D) probability
Unlock Deck
Unlock for access to all 26 flashcards in this deck.
Unlock Deck
k this deck
16
A data set consisting of observations on only a single characteristic,or attribute,is a _____ data set.
A) bivariate
B) multivariate
C) random
D) univariate
A) bivariate
B) multivariate
C) random
D) univariate
Unlock Deck
Unlock for access to all 26 flashcards in this deck.
Unlock Deck
k this deck
17
When two distinct symmetric unimodal populations with different centers are mixed,the resulting distribution will likely be:
A) unimodal.
B) quasimodal.
C) bimodal.
D) skewed.
A) unimodal.
B) quasimodal.
C) bimodal.
D) skewed.
Unlock Deck
Unlock for access to all 26 flashcards in this deck.
Unlock Deck
k this deck
18
Concerning univariate data,a _____ or _____ data set consists of non-numerical observations that may be placed in categories.
A) categorical;qualitative
B) categorical;quantitative
C) numerical;quantitative
D) numerical;qualitative
A) categorical;qualitative
B) categorical;quantitative
C) numerical;quantitative
D) numerical;qualitative
Unlock Deck
Unlock for access to all 26 flashcards in this deck.
Unlock Deck
k this deck
19
A frequency distribution table is BEST suited to summarize which type of data?
A) continuous
B) bivariate
C) multivariate
D) qualitative
A) continuous
B) bivariate
C) multivariate
D) qualitative
Unlock Deck
Unlock for access to all 26 flashcards in this deck.
Unlock Deck
k this deck
20
A distribution with only one peak is called:
A) single peaking.
B) multimodal.
C) bimodal.
D) unimodal.
A) single peaking.
B) multimodal.
C) bimodal.
D) unimodal.
Unlock Deck
Unlock for access to all 26 flashcards in this deck.
Unlock Deck
k this deck
21
A survey of the patients waiting to be seen in an emergency room recorded the mode of arrival,the waiting time,whether or not the patient is insured,and the blood type of the patients.This would result in what type of data set?
A) bivariate
B) multivariate
C) random
D) univariate
A) bivariate
B) multivariate
C) random
D) univariate
Unlock Deck
Unlock for access to all 26 flashcards in this deck.
Unlock Deck
k this deck
22
A survey records the average study time spent each week by students at a large university.What type of data are these?
A) continuous
B) discrete
C) qualitative
D) categorical
A) continuous
B) discrete
C) qualitative
D) categorical
Unlock Deck
Unlock for access to all 26 flashcards in this deck.
Unlock Deck
k this deck
23
A student counted the number of candies of each color in a bag of 57 Reese's Pieces.The results are shown in the following bar graph. What percentage of the candies were NOT colored orange?
A) 21%
B) 28%
C) 49%
D) 51%
What percentage of the candies were NOT colored orange?A) 21%
B) 28%
C) 49%
D) 51%
Unlock Deck
Unlock for access to all 26 flashcards in this deck.
Unlock Deck
k this deck
24
A student counted the number of candies of each color in a bag of 57 Reese's Pieces.The results are shown in the following bar graph. How many of the candies were colored orange?
A) 12
B) 51
C) 29
D) More information is needed to answer the question.
How many of the candies were colored orange?A) 12
B) 51
C) 29
D) More information is needed to answer the question.
Unlock Deck
Unlock for access to all 26 flashcards in this deck.
Unlock Deck
k this deck
25
A survey records the number of U.S.states each person has visited.This is an example of what type of data?
A) categorical
B) continuous
C) discrete
D) qualitative
A) categorical
B) continuous
C) discrete
D) qualitative
Unlock Deck
Unlock for access to all 26 flashcards in this deck.
Unlock Deck
k this deck
26
A 2012 survey examined cell phone ownership by U.S.adults.The results of the survey are shown in the pie chart below. What percentage of the adults surveyed did NOT own a smartphone?
A) 13%
B) 45.9%
C) 41%
D) 54%
What percentage of the adults surveyed did NOT own a smartphone?A) 13%
B) 45.9%
C) 41%
D) 54%
Unlock Deck
Unlock for access to all 26 flashcards in this deck.
Unlock Deck
k this deck
Unlock Deck
Unlock for access to all 26 flashcards in this deck.


