Deck 13: Correlation Research
Full screen (f)
Question
Question
Question
Question
Question
Question
Question
Question
Question
Question
Question
Question
Question
Question
Question
Question
Question
Question
Question
Question
Question
Question
Question
Question
Question
Question
Question
Question
Question
Question
Question
Question
Question
Question
Question
Question
Question
Question
Question
Question
Question
Question
The following graph resulted when a researcher plotted the paired scores from two sets of data: 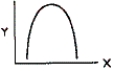
Which of the following conclusions is justified from an examination of the graph?
A) The coefficient of correlation is close to .50.
B) The correlation between X and Y is negative and low.
C) The correlation between X and Y is positive and high.
D) A Spearman rho coefficient of correlation is appropriate for these data.
E) A Pearson's coefficient of correlation is not appropriate for these data.
Question
Question
Question
Question
Question
Question
Question
Question
Question
Question
Question
Question
Question
Question
Question
Question
Question
Question
Question
Question
Question
Question
Question
Question
Question
Question
Question
Question
Question
Question
Question
Question
Question
Question
Question
Question
Question
Question

Unlock Deck
Sign up to unlock the cards in this deck!
Unlock Deck
Unlock Deck
1/121
Play
Full screen (f)
Deck 13: Correlation Research
1
Exhibit 13-1: Identify the kind of correlation appropriate for use in solving each of the following problems.
Refer to Exhibit 13-1.To find the relationship between achievement test and intelligence test scores.
A) Pearson's r
B) Spearman rho
C) phi coefficient
Refer to Exhibit 13-1.To find the relationship between achievement test and intelligence test scores.
A) Pearson's r
B) Spearman rho
C) phi coefficient
A
2
Exhibit 13-3: Compare the following coefficients of correlation and their corresponding Ns, then answer the questions.Notice that all correlation values are statistically significant.
Refer to Exhibit 13-3.Which coefficient of correlation permits more accurate prediction of one variable from the other?
A) r = +.80 N = 80
B) r = +.32 N = 300
C) r = -32 N = 40
D) r = -.87 N = 80
Refer to Exhibit 13-3.Which coefficient of correlation permits more accurate prediction of one variable from the other?
A) r = +.80 N = 80
B) r = +.32 N = 300
C) r = -32 N = 40
D) r = -.87 N = 80
D
3
Exhibit 13-2: Choose the correlation coefficient that matches the following types of scales.
Refer to Exhibit 13-2.Both variables are on an interval or ratio scale.
A) Pearson's r
B) Spearman rho
C) phi coefficient
Refer to Exhibit 13-2.Both variables are on an interval or ratio scale.
A) Pearson's r
B) Spearman rho
C) phi coefficient
A
4
Exhibit 13-1: Identify the kind of correlation appropriate for use in solving each of the following problems.
Refer to Exhibit 13-1.To find the relationship between passing or failing a test and responses on a survey item answered "yes" or "no."
A) Pearson's r
B) Spearman's rho
C) phi coefficient
Refer to Exhibit 13-1.To find the relationship between passing or failing a test and responses on a survey item answered "yes" or "no."
A) Pearson's r
B) Spearman's rho
C) phi coefficient
Unlock Deck
Unlock for access to all 121 flashcards in this deck.
Unlock Deck
k this deck
5
The technique used to find the relationship between two variables when the common influence of one or more variables is removed is called
A) partial correlation.
B) multiple correlation.
C) correlation ratio.
D) tetrachoric correlation.
A) partial correlation.
B) multiple correlation.
C) correlation ratio.
D) tetrachoric correlation.
Unlock Deck
Unlock for access to all 121 flashcards in this deck.
Unlock Deck
k this deck
6
A researcher found a correlation of +1.21 between variables A and B.This means that
A) there is a high relationship between the two variables.
B) the relationship between the two variables is perfect.
C) the variables could be predicted from one another with a high degree of accuracy.
D) a mistake has been made in computation of the coefficient of correlation between the two variables
Unlock Deck
Unlock for access to all 121 flashcards in this deck.
Unlock Deck
k this deck
7
Exhibit 13-2: Choose the correlation coefficient that matches the following types of scales.
Refer to Exhibit 13-2.Both variables are on an ordinal scale.
A) Pearson's r
B) Spearman rho
C) phi coefficient
Refer to Exhibit 13-2.Both variables are on an ordinal scale.
A) Pearson's r
B) Spearman rho
C) phi coefficient
Unlock Deck
Unlock for access to all 121 flashcards in this deck.
Unlock Deck
k this deck
8
The prediction of Y from Variable X would be least accurate when the correlation between X and Y is
A) 75.
B) .95.
C) .99.
D) -.80.
E) -1.00.
A) 75.
B) .95.
C) .99.
D) -.80.
E) -1.00.
Unlock Deck
Unlock for access to all 121 flashcards in this deck.
Unlock Deck
k this deck
9
Exhibit 13-1: Identify the kind of correlation appropriate for use in solving each of the following problems.
Refer to Exhibit 13-1.To find the relationship between male or female responses on a survey item answered "yes" or "no."
A) Pearson's r
B) Spearman rho
C) phi coefficient
Refer to Exhibit 13-1.To find the relationship between male or female responses on a survey item answered "yes" or "no."
A) Pearson's r
B) Spearman rho
C) phi coefficient
Unlock Deck
Unlock for access to all 121 flashcards in this deck.
Unlock Deck
k this deck
10
Exhibit 13-1: Identify the kind of correlation appropriate for use in solving each of the following problems.
Refer to Exhibit 13-1.To find the relationship between SAT scores and GPA in college.
A) Pearson's r
B) Spearman rho
C) phi coefficient
Refer to Exhibit 13-1.To find the relationship between SAT scores and GPA in college.
A) Pearson's r
B) Spearman rho
C) phi coefficient
Unlock Deck
Unlock for access to all 121 flashcards in this deck.
Unlock Deck
k this deck
11
The technique used to find the relationship between curvilinear variables is called
A) correlation ratio.
B) tetrachoric correlation.
C) multiple correlation.
D) partial correlation.
A) correlation ratio.
B) tetrachoric correlation.
C) multiple correlation.
D) partial correlation.
Unlock Deck
Unlock for access to all 121 flashcards in this deck.
Unlock Deck
k this deck
12
The appropriate statistic used to find the relationship between teachers' rankings of students' leadership ability and their rankings of students' communication skills is
A) Pearson's r.
B) Spearman's rho.
C) correlation ratio.
D) biserial correlation.
A) Pearson's r.
B) Spearman's rho.
C) correlation ratio.
D) biserial correlation.
Unlock Deck
Unlock for access to all 121 flashcards in this deck.
Unlock Deck
k this deck
13
Exhibit 13-1: Identify the kind of correlation appropriate for use in solving each of the following problems.
Refer to Exhibit 13-1.To find the relationship between high school GPA rank and rank on a popularity measure.
A) Pearson's r
B) Spearman rho
C) phi coefficient
Refer to Exhibit 13-1.To find the relationship between high school GPA rank and rank on a popularity measure.
A) Pearson's r
B) Spearman rho
C) phi coefficient
Unlock Deck
Unlock for access to all 121 flashcards in this deck.
Unlock Deck
k this deck
14
Exhibit 13-1: Identify the kind of correlation appropriate for use in solving each of the following problems.
Refer to Exhibit 13-1.To find the relationship between gender and watching a specific TV program or another in the same time slot.
A) Pearson's r
B) Spearman rho
C) phi coefficient
Refer to Exhibit 13-1.To find the relationship between gender and watching a specific TV program or another in the same time slot.
A) Pearson's r
B) Spearman rho
C) phi coefficient
Unlock Deck
Unlock for access to all 121 flashcards in this deck.
Unlock Deck
k this deck
15
The phi coefficient is used to find the relationship between two variables which are both measured on a(n)
A) interval scale.
B) ratio scale.
C) nominal scale.
D) ordinal scale.
A) interval scale.
B) ratio scale.
C) nominal scale.
D) ordinal scale.
Unlock Deck
Unlock for access to all 121 flashcards in this deck.
Unlock Deck
k this deck
16
Exhibit 13-3: Compare the following coefficients of correlation and their corresponding Ns, then answer the questions.Notice that all correlation values are statistically significant.
Refer to Exhibit 13-3.Which coefficient of correlation is least significant?
A) r = +.80 N = 80
B) r = +.32 N = 300
C) r = -32 N = 40
D) r = -.87 N = 80
Refer to Exhibit 13-3.Which coefficient of correlation is least significant?
A) r = +.80 N = 80
B) r = +.32 N = 300
C) r = -32 N = 40
D) r = -.87 N = 80
Unlock Deck
Unlock for access to all 121 flashcards in this deck.
Unlock Deck
k this deck
17
Exhibit 13-2: Choose the correlation coefficient that matches the following types of scales.
Refer to Exhibit 13-2.Both variables are genuinely dichotomous (nominal).
A) Pearson's r
B) Spearman rho
C) phi coefficient
Refer to Exhibit 13-2.Both variables are genuinely dichotomous (nominal).
A) Pearson's r
B) Spearman rho
C) phi coefficient
Unlock Deck
Unlock for access to all 121 flashcards in this deck.
Unlock Deck
k this deck
18
One wants to find the correlation between social adjustment and achievement with the effects of intelligence controlled.The appropriate index to use is
A) correlation ratio.
B) tetrachoric correlation.
C) multiple correlation.
D) partial correlation.
A) correlation ratio.
B) tetrachoric correlation.
C) multiple correlation.
D) partial correlation.
Unlock Deck
Unlock for access to all 121 flashcards in this deck.
Unlock Deck
k this deck
19
Exhibit 13-3: Compare the following coefficients of correlation and their corresponding Ns, then answer the questions.Notice that all correlation values are statistically significant.
Refer to Exhibit 13-3.The coefficient for which the coefficient of determination equals .64?
A) r = +.80 N = 80
B) r = +.32 N = 300
C) r = -32 N = 40
D) r = -.87 N = 80
Refer to Exhibit 13-3.The coefficient for which the coefficient of determination equals .64?
A) r = +.80 N = 80
B) r = +.32 N = 300
C) r = -32 N = 40
D) r = -.87 N = 80
Unlock Deck
Unlock for access to all 121 flashcards in this deck.
Unlock Deck
k this deck
20
Exhibit 13-3: Compare the following coefficients of correlation and their corresponding Ns, then answer the questions.Notice that all correlation values are statistically significant.
Refer to Exhibit 13-3.Which coefficient of correlation involves a greater number of degrees of freedom?
A) r = +.80 N = 80
B) r = +.32 N = 300
C) r = -32 N = 40
D) r = -.87 N = 80
Refer to Exhibit 13-3.Which coefficient of correlation involves a greater number of degrees of freedom?
A) r = +.80 N = 80
B) r = +.32 N = 300
C) r = -32 N = 40
D) r = -.87 N = 80
Unlock Deck
Unlock for access to all 121 flashcards in this deck.
Unlock Deck
k this deck
21
It is appropriate to use "dummy variables" in multiple regression when
A) there may be a nonlinear relationship between the independent variables and the dependent variable.
B) all independent variables are interval or ratio.
C) some of the independent variables are categorical.
D) there may be nonnormality in the independent variables.
A) there may be a nonlinear relationship between the independent variables and the dependent variable.
B) all independent variables are interval or ratio.
C) some of the independent variables are categorical.
D) there may be nonnormality in the independent variables.
Unlock Deck
Unlock for access to all 121 flashcards in this deck.
Unlock Deck
k this deck
22
The standard error of estimate is equal to the standard deviation of Y scores when the
A) correlation between X and Y = 0.
B) correlation between X and Y = 1.0.
C) mean on X is equal to the mean on Y.
D) standard deviation of X is equal to the standard deviation of Y.
E) distributions of X and Y are normal.
A) correlation between X and Y = 0.
B) correlation between X and Y = 1.0.
C) mean on X is equal to the mean on Y.
D) standard deviation of X is equal to the standard deviation of Y.
E) distributions of X and Y are normal.
Unlock Deck
Unlock for access to all 121 flashcards in this deck.
Unlock Deck
k this deck
23
In a sample of 18, the correlation between intelligence test scores and creativity test scores was found to be .40.Do these data provide evidence for a significant relationship between these variables in the population? Test at the .05 level of significance (two tailed).Table A5 shows a correlation of .4683 for 16 degrees of freedom.
A) These data provide evidence of a significant relationship between intelligence and creativity.
B) These data do not provide evidence of a significant relationship between intelligence and creativity.
C) The significance of the relationship cannot be determined from the data given.
A) These data provide evidence of a significant relationship between intelligence and creativity.
B) These data do not provide evidence of a significant relationship between intelligence and creativity.
C) The significance of the relationship cannot be determined from the data given.
Unlock Deck
Unlock for access to all 121 flashcards in this deck.
Unlock Deck
k this deck
24
Exhibit 13-4: The following are the results of three factor analyses from tests 1 and 2.Data shown are factor loadings.
-Refer to Exhibit 13-4.Test 2, Factor B appears to be a measure of
A) reading comprehension.
B) English usage.
C) math understanding and application.
D) math computation.
-Refer to Exhibit 13-4.Test 2, Factor B appears to be a measure of
A) reading comprehension.
B) English usage.
C) math understanding and application.
D) math computation.
Unlock Deck
Unlock for access to all 121 flashcards in this deck.
Unlock Deck
k this deck
25
If a computed Pearson's correlation coefficient is statistically significant at the .01 level,
A) the correlation coefficient is extremely accurate.
B) the two variables are positively correlated.
C) an important relationship is evident.
D) it is highly likely that a relationship exists between the two variables in the population.
E) it is highly unlikely that a relationship exists between the two variables in the population.
Unlock Deck
Unlock for access to all 121 flashcards in this deck.
Unlock Deck
k this deck
26
A researcher correlated achievement test scores in mathematics and science, but later learned that the tests were too easy for the students.The outcome of the correlational analysis will be
A) the same as if the researcher had used tests of appropriate difficulty.
B) spuriously high because the easy exams will produce high scores and therefore high correlations.
C) genuinely high.
D) low because the easy tests will restrict the variation in scores on the two tests.
A) the same as if the researcher had used tests of appropriate difficulty.
B) spuriously high because the easy exams will produce high scores and therefore high correlations.
C) genuinely high.
D) low because the easy tests will restrict the variation in scores on the two tests.
Unlock Deck
Unlock for access to all 121 flashcards in this deck.
Unlock Deck
k this deck
27
A researcher found a correlation of .40 between aptitude test scores and school achievement.What proportion of the variance in school achievement can be attributed to variables other than aptitude?
A) .16
B) .40
C) .60
D) .84
A) .16
B) .40
C) .60
D) .84
Unlock Deck
Unlock for access to all 121 flashcards in this deck.
Unlock Deck
k this deck
28
A major reason for conducting correlational studies is to
A) establish cause-and-effect relationships among variables.
B) determine the effectiveness of various instructional methods.
C) identify variables that have a substantial relationship with certain dependent variables.
A) establish cause-and-effect relationships among variables.
B) determine the effectiveness of various instructional methods.
C) identify variables that have a substantial relationship with certain dependent variables.
Unlock Deck
Unlock for access to all 121 flashcards in this deck.
Unlock Deck
k this deck
29
The basic aim of multiple regression is to
A) calculate the correlation between a combination of independent variables and a number of dependent variables.
B) calculate the average of a combination of correlation coefficients between predictors and criterion.
C) develop a correlation matrix.
D) calculate the correlation between a combination of independent variables and a single dependent variable.
Unlock Deck
Unlock for access to all 121 flashcards in this deck.
Unlock Deck
k this deck
30
A research study found that the multiple correlation (R) of three variables (SAT, HS rank, and HS GPA) with freshman college GPA was .60.The researcher would report that
A) the average correlation of each of the variables with college GPA is .20.
B) 60 percent of the variance in college GPA can be explained by the combined variables.
C) 36 percent of the variance in college GPA can be explained by the three variables in combination.
A) the average correlation of each of the variables with college GPA is .20.
B) 60 percent of the variance in college GPA can be explained by the combined variables.
C) 36 percent of the variance in college GPA can be explained by the three variables in combination.
Unlock Deck
Unlock for access to all 121 flashcards in this deck.
Unlock Deck
k this deck
31
A researcher who fails to reject the null hypothesis in a correlational analysis, should conclude
A) the correlation between X and Y in the population is not zero.
B) the correlation between X and Y in the population is less than zero.
C) there is insufficient evidence for concluding there is a relationship between X and Y in the population.
D) the observed relationship between X and Y is stronger than would be expected by chance.
E) the correlation between X and Y in the population is zero.
Unlock Deck
Unlock for access to all 121 flashcards in this deck.
Unlock Deck
k this deck
32
In a prediction study, the standard error of estimate was equal to 6.What percentage of the actual Y scores will be within 6 points of the predicted Y scores?
A) 16
B) 50
C) 68
D) 95
E) 99
A) 16
B) 50
C) 68
D) 95
E) 99
Unlock Deck
Unlock for access to all 121 flashcards in this deck.
Unlock Deck
k this deck
33
A predictor variable is most likely to receive a large regression weight in a multiple regression analysis if
A) it has high correlation with the criterion and high correlation with other predictors.
B) it has both high reliability and high correlation with the criterion.
C) it has a greater number of maximum possible points.
D) it has high correlation with the criterion but is unrelated to other predictors.
Unlock Deck
Unlock for access to all 121 flashcards in this deck.
Unlock Deck
k this deck
34
The standard error of estimate is the standard deviation of
A) the distribution of the observed Y scores.
B) the predicted scores on Y.
C) the X scores used to predict Y.
D) the differences between actual and predicted Y scores.
E) the X scores for those who have identical scores on Y.
A) the distribution of the observed Y scores.
B) the predicted scores on Y.
C) the X scores used to predict Y.
D) the differences between actual and predicted Y scores.
E) the X scores for those who have identical scores on Y.
Unlock Deck
Unlock for access to all 121 flashcards in this deck.
Unlock Deck
k this deck
35
The "standard error of estimate" refers to the variability of
A) predicted values around the regression line.
B) actual score values around predicted values.
C) average predicted scores around true scores.
D) predictor scores around the regression line.
A) predicted values around the regression line.
B) actual score values around predicted values.
C) average predicted scores around true scores.
D) predictor scores around the regression line.
Unlock Deck
Unlock for access to all 121 flashcards in this deck.
Unlock Deck
k this deck
36
Exhibit 13-4: The following are the results of three factor analyses from tests 1 and 2.Data shown are factor loadings.
-Refer to Exhibit 13-4.Which test and factor appear to best measure what might be called a verbal ability?
A) Test 1, Factor A
B) Test 1, Factor C
C) Test 2, Factor A
D) Test 2, Factor B
-Refer to Exhibit 13-4.Which test and factor appear to best measure what might be called a verbal ability?
A) Test 1, Factor A
B) Test 1, Factor C
C) Test 2, Factor A
D) Test 2, Factor B
Unlock Deck
Unlock for access to all 121 flashcards in this deck.
Unlock Deck
k this deck
37
The standard error of estimate is equal to zero only if the
A) correlation between X and Y = 0.
B) correlation between X and Y = 1.0.
C) mean on X is equal to the mean on Y.
D) standard deviation of X is equal to the standard deviation of Y.
E) distributions of X and Y are normal.
A) correlation between X and Y = 0.
B) correlation between X and Y = 1.0.
C) mean on X is equal to the mean on Y.
D) standard deviation of X is equal to the standard deviation of Y.
E) distributions of X and Y are normal.
Unlock Deck
Unlock for access to all 121 flashcards in this deck.
Unlock Deck
k this deck
38
Other things being equal, as the sample size increases the critical value for the Pearson's r
A) increases.
B) decreases.
C) is not affected.
D) becomes more precise.
E) a and d
A) increases.
B) decreases.
C) is not affected.
D) becomes more precise.
E) a and d
Unlock Deck
Unlock for access to all 121 flashcards in this deck.
Unlock Deck
k this deck
39
When testing the statistical significance of a correlation coefficient, the null hypothesis states
A) r = 0, the population correlation is zero.
B) r = +1.00 or -1.00, the population correlation is +1.00 or -1.00.
C) r = 0, the sample correlation is zero.
D) r = +1.00 or -1.00 the sample correlation is +1.00 or -1.00.
A) r = 0, the population correlation is zero.
B) r = +1.00 or -1.00, the population correlation is +1.00 or -1.00.
C) r = 0, the sample correlation is zero.
D) r = +1.00 or -1.00 the sample correlation is +1.00 or -1.00.
Unlock Deck
Unlock for access to all 121 flashcards in this deck.
Unlock Deck
k this deck
40
The process of applying a prediction equation to another sample independent of the sample on which the equation was calculated is called
A) construct validation.
B) convergent validation.
C) discriminant validation.
D) cross-validation.
E) concurrent validation.
A) construct validation.
B) convergent validation.
C) discriminant validation.
D) cross-validation.
E) concurrent validation.
Unlock Deck
Unlock for access to all 121 flashcards in this deck.
Unlock Deck
k this deck
41
If a relationship between two variables is spurious, we conclude that it is
A) nearly always a cause and effect relationship.
B) partially regressed.
C) accounted for by another extraneous variable
D) not a statistically significant relationship.
E)
A) nearly always a cause and effect relationship.
B) partially regressed.
C) accounted for by another extraneous variable
D) not a statistically significant relationship.
E)
Unlock Deck
Unlock for access to all 121 flashcards in this deck.
Unlock Deck
k this deck
42
The following graph resulted when a researcher plotted the paired scores from two sets of data:
Which of the following conclusions is justified from an examination of the graph?
A) The coefficient of correlation is close to .50.
B) The correlation between X and Y is negative and low.
C) The correlation between X and Y is positive and high.
D) A Spearman rho coefficient of correlation is appropriate for these data.
E) A Pearson's coefficient of correlation is not appropriate for these data.
Unlock Deck
Unlock for access to all 121 flashcards in this deck.
Unlock Deck
k this deck
43
Research shows that aptitude scores are better predictors of achievement in the lower grades than in college.This finding can best be interpreted to mean that
A) college students are not as predictable as elementary school pupils.
B) aptitude tests should not be used with college students.
C) there is less variability in aptitude and achievement among elementary school students than among college students.
D) there is greater variability in aptitude and achievement among elementary school students than among college students.
E) college teachers tend to be more objective in grading than elementary school teachers.
Unlock Deck
Unlock for access to all 121 flashcards in this deck.
Unlock Deck
k this deck
44
The most useful correlational technique to use when one wants to test a causal hypothesis is
A) factor analysis.
B) path analysis.
C) discriminant analysis.
D) regression analysis.
A) factor analysis.
B) path analysis.
C) discriminant analysis.
D) regression analysis.
Unlock Deck
Unlock for access to all 121 flashcards in this deck.
Unlock Deck
k this deck
45
Research has shown that high school students' scores on the SAT correlate .40 with college freshman grades.Assuming that only half of the students who took the SAT were admitted to a given college, what would you estimate the correlation to be between their SAT scores and freshman grades?
A) Negative and lower than .40
B) Negative and higher than .40
C) Positive and higher than .40
D) Positive and lower than .40
A) Negative and lower than .40
B) Negative and higher than .40
C) Positive and higher than .40
D) Positive and lower than .40
Unlock Deck
Unlock for access to all 121 flashcards in this deck.
Unlock Deck
k this deck
46
Exhibit 13-5.Choose the type of correlational statistic that would be used for each of the purposes listed.
Refer to Exhibit 13-5.Used to determine whether a set of variables can be reduced to a smaller number of measures
A) Product-moment correlation
B) Partial correlation
C) Factor analysis
D) Canonical correlation
E) Multiple regression
Refer to Exhibit 13-5.Used to determine whether a set of variables can be reduced to a smaller number of measures
A) Product-moment correlation
B) Partial correlation
C) Factor analysis
D) Canonical correlation
E) Multiple regression
Unlock Deck
Unlock for access to all 121 flashcards in this deck.
Unlock Deck
k this deck
47
Before calculating a correlation coefficient, a researcher wants to determine whether the relationship between the two variables is linear.Which of the following would be most appropriate to use?
A) Histogram
B) Frequency polygon
C) Data matrix
D) Scatterplot
A) Histogram
B) Frequency polygon
C) Data matrix
D) Scatterplot
Unlock Deck
Unlock for access to all 121 flashcards in this deck.
Unlock Deck
k this deck
48
The Pearson's product-moment correlation coefficient is used to measure the
A) magnitude of the curvilinear relationship between two variables.
B) linearity of the relationship between two variables.
C) direction of the curvilinear relationship between two variables.
D) magnitude and direction of the linear relationship between two variables.
A) magnitude of the curvilinear relationship between two variables.
B) linearity of the relationship between two variables.
C) direction of the curvilinear relationship between two variables.
D) magnitude and direction of the linear relationship between two variables.
Unlock Deck
Unlock for access to all 121 flashcards in this deck.
Unlock Deck
k this deck
49
A correlational design often achieves control through the use of
A)counterbalancing.
B)random selection.
C)partial correlation.
D)matching.
A)counterbalancing.
B)random selection.
C)partial correlation.
D)matching.
Unlock Deck
Unlock for access to all 121 flashcards in this deck.
Unlock Deck
k this deck
50
If X is positively correlated with Y, one can conclude that
A) X probably causes changes in Y.
B) Y probably causes changes in X.
C) changes in X and Y are both probably caused by Z.
D) None of these is true.
A) X probably causes changes in Y.
B) Y probably causes changes in X.
C) changes in X and Y are both probably caused by Z.
D) None of these is true.
Unlock Deck
Unlock for access to all 121 flashcards in this deck.
Unlock Deck
k this deck
51
A researcher wishes to predict those college students who will be persistent in their education, that is, those who will stay in college and graduate within five years as opposed to those who will not complete a degree within five years.Which of the following methods would the researcher use?
A) Factor analysis
B) Partial correlation
C) Path analysis
D) Multiple regression
E) Discriminant analysis
A) Factor analysis
B) Partial correlation
C) Path analysis
D) Multiple regression
E) Discriminant analysis
Unlock Deck
Unlock for access to all 121 flashcards in this deck.
Unlock Deck
k this deck
52
Which of the following statistics is most important in the calculation of test validity and reliability?
A) Standard error of estimate
B) Coefficient of correlation
C) Median
D) Percentile
E) Standard deviation
A) Standard error of estimate
B) Coefficient of correlation
C) Median
D) Percentile
E) Standard deviation
Unlock Deck
Unlock for access to all 121 flashcards in this deck.
Unlock Deck
k this deck
53
Under which of the following conditions would one expect multiple correlation coefficients to show relatively large shrinkage?
A) When the original sample is small
B) When the original sample is large
A) When the original sample is small
B) When the original sample is large
Unlock Deck
Unlock for access to all 121 flashcards in this deck.
Unlock Deck
k this deck
54
The purpose of cross-validation is to
A) validate the test for different criteria.
B) try out the test with the same sample after a period of time.
C) confirm the correlation in a different sample.
A) validate the test for different criteria.
B) try out the test with the same sample after a period of time.
C) confirm the correlation in a different sample.
Unlock Deck
Unlock for access to all 121 flashcards in this deck.
Unlock Deck
k this deck
55
Consider the correlation matrix below with independent variables A, B, and C and dependent variable Y
Which of the variables A, B, or C will enter first in a stepwise multiple regression equation?
A) A
B) B
C) C
D) cannot tell from the data given
Which of the variables A, B, or C will enter first in a stepwise multiple regression equation?
A) A
B) B
C) C
D) cannot tell from the data given
Unlock Deck
Unlock for access to all 121 flashcards in this deck.
Unlock Deck
k this deck
56
If one fails to reject the null hypothesis in a multiple regression analysis, then one concludes
A) there is no evidence for a relation between the combination of independent variables and the dependent variable.
B) the observed relationship between the independent variables in combination and the dependent variable is greater than would be expected by chance.
C) the population correlation between X and Y is not zero.
D) the population correlation between X and Y is less than zero.
Unlock Deck
Unlock for access to all 121 flashcards in this deck.
Unlock Deck
k this deck
57
Assume you are using GRE scores and undergraduate grades to predict graduate GPA.If the correlation of GRE scores and undergraduate grades were .18 rather than .56, then GRE scores would be ____ for predicting graduate GPA.
A) more useful
B) equally useful
C) less useful
A) more useful
B) equally useful
C) less useful
Unlock Deck
Unlock for access to all 121 flashcards in this deck.
Unlock Deck
k this deck
58
Exhibit 13-5.Choose the type of correlational statistic that would be used for each of the purposes listed.
Refer to Exhibit 13-5.Used to describe the extent of relationship between two variables, X and Y, after the influence of a third variable, Z, has been removed.
A) Product-moment correlation
B) Partial correlation
C) Factor analysis
D) Canonical correlation
E) Multiple regression
Refer to Exhibit 13-5.Used to describe the extent of relationship between two variables, X and Y, after the influence of a third variable, Z, has been removed.
A) Product-moment correlation
B) Partial correlation
C) Factor analysis
D) Canonical correlation
E) Multiple regression
Unlock Deck
Unlock for access to all 121 flashcards in this deck.
Unlock Deck
k this deck
59
A high negative correlation was found between days absent from school and grade achievement for middle school students.This finding means that
A) absence from school causes low achievement.
B) students who miss school more often tend to make lower grades than students who attend regularly.
C) low achievement causes high absence from school.
D) measures on the two variables do not tend to covary.
A) absence from school causes low achievement.
B) students who miss school more often tend to make lower grades than students who attend regularly.
C) low achievement causes high absence from school.
D) measures on the two variables do not tend to covary.
Unlock Deck
Unlock for access to all 121 flashcards in this deck.
Unlock Deck
k this deck
60
The correlation between the Graduate Record Examination (GRE) and undergraduate GPA for all people taking the GRE is .56.If the correlation is recomputed for only those students admitted to graduate school, the value of the correlation will most likely
A) increase.
B) decrease.
C) stay the same.
A) increase.
B) decrease.
C) stay the same.
Unlock Deck
Unlock for access to all 121 flashcards in this deck.
Unlock Deck
k this deck
61
Exhibit 13-6: A researcher collects the following measures on a sample of college students: scores on the SAT and the ACT, scores on an English composition test, high school class rank, scores on a noncognitive measure, whether or not students successfully completed the first year of college (pass-fail), and their GPA.Choose the statistical procedures that the researcher should use to answer the following questions.
Refer to Exhibit 13-6.Is SAT or ACT the better single predictor of GPA?
A) Partial correlation
B) Factor analysis
C) Multiple regression
D) Discriminant analysis
E) Product-moment correlation
Refer to Exhibit 13-6.Is SAT or ACT the better single predictor of GPA?
A) Partial correlation
B) Factor analysis
C) Multiple regression
D) Discriminant analysis
E) Product-moment correlation
Unlock Deck
Unlock for access to all 121 flashcards in this deck.
Unlock Deck
k this deck
62
A measure of political conservatism was administered to representative samples of persons of ages 18, 21, 30, 45, and 60, and their respective mean scores were 65, 90, 85, 75, 70.The correlation between age and political conservatism is
A) 1.0.
B) -1.0.
C) linear.
D) curvilinear.
A) 1.0.
B) -1.0.
C) linear.
D) curvilinear.
Unlock Deck
Unlock for access to all 121 flashcards in this deck.
Unlock Deck
k this deck
63
What is the best way for a researcher, in an exploratory study, to show the correlations among all the variables?
A) Scattergram
B) Correlation ratio
C) Linear regression equation
D) Correlation matrix
E) Expectancy table
A) Scattergram
B) Correlation ratio
C) Linear regression equation
D) Correlation matrix
E) Expectancy table
Unlock Deck
Unlock for access to all 121 flashcards in this deck.
Unlock Deck
k this deck
64
If a test is going to predict a criterion well, the correlation between the test and the criterion should be
A) around .00 to indicate no errors of estimate.
B) a large, positive coefficient of correlation.
C) either a large positive or large negative correlation.
D) a large, negative coefficient of correlation.
A) around .00 to indicate no errors of estimate.
B) a large, positive coefficient of correlation.
C) either a large positive or large negative correlation.
D) a large, negative coefficient of correlation.
Unlock Deck
Unlock for access to all 121 flashcards in this deck.
Unlock Deck
k this deck
65
Exhibit 13-5.Choose the type of correlational statistic that would be used for each of the purposes listed.
Refer to Exhibit 13-5.Used to describe the relationship between two variables measured on an interval scale
A) Product-moment correlation
B) Partial correlation
C) Factor analysis
D) Canonical correlation
E) Multiple regression
Refer to Exhibit 13-5.Used to describe the relationship between two variables measured on an interval scale
A) Product-moment correlation
B) Partial correlation
C) Factor analysis
D) Canonical correlation
E) Multiple regression
Unlock Deck
Unlock for access to all 121 flashcards in this deck.
Unlock Deck
k this deck
66
An advantage of correlational studies is that they
A) focus on an individual or small groups in depth.
B) isolate cause-effect relationships between variables.
C) indicate the strength of relationship between variables.
D) provide for control of extraneous variables.
A) focus on an individual or small groups in depth.
B) isolate cause-effect relationships between variables.
C) indicate the strength of relationship between variables.
D) provide for control of extraneous variables.
Unlock Deck
Unlock for access to all 121 flashcards in this deck.
Unlock Deck
k this deck
67
In which college would you expect the correlation between aptitude test score and gradepoint average to be greatest?
A) College A
B) College B
C) College C
A) College A
B) College B
C) College C
Unlock Deck
Unlock for access to all 121 flashcards in this deck.
Unlock Deck
k this deck
68
The correlation between a predictor and a criterion is .84.This means that the criterion has about ____ percent of its variance in common with the predictor.
A) 16
B) 42
C) 70
D) 84
A) 16
B) 42
C) 70
D) 84
Unlock Deck
Unlock for access to all 121 flashcards in this deck.
Unlock Deck
k this deck
69
Exhibit 13-6: A researcher collects the following measures on a sample of college students: scores on the SAT and the ACT, scores on an English composition test, high school class rank, scores on a noncognitive measure, whether or not students successfully completed the first year of college (pass-fail), and their GPA.Choose the statistical procedures that the researcher should use to answer the following questions.
Refer to Exhibit 13-6.Does the combination of variables predict whether or not students successfully completed the first year of college?
A) Partial correlation
B) Factor analysis
C) Multiple regression
D) Discriminant analysis
E) Product-moment correlation
Refer to Exhibit 13-6.Does the combination of variables predict whether or not students successfully completed the first year of college?
A) Partial correlation
B) Factor analysis
C) Multiple regression
D) Discriminant analysis
E) Product-moment correlation
Unlock Deck
Unlock for access to all 121 flashcards in this deck.
Unlock Deck
k this deck
70
Exhibit 13-6: A researcher collects the following measures on a sample of college students: scores on the SAT and the ACT, scores on an English composition test, high school class rank, scores on a noncognitive measure, whether or not students successfully completed the first year of college (pass-fail), and their GPA.Choose the statistical procedures that the researcher should use to answer the following questions.
Refer to Exhibit 13-6.Do all the measures used in this study measure something in common?
A) Partial correlation
B) Factor analysis
C) Multiple regression
D) Discriminant analysis
E) Product-moment correlation
Refer to Exhibit 13-6.Do all the measures used in this study measure something in common?
A) Partial correlation
B) Factor analysis
C) Multiple regression
D) Discriminant analysis
E) Product-moment correlation
Unlock Deck
Unlock for access to all 121 flashcards in this deck.
Unlock Deck
k this deck
71
A study with college students found no correlation between hours of study for an examination and test performance.This probably means
A) the amount of study time by a student has no effect on test scores.
B) hours of study and test performance are both influenced by a third variable, scholastic aptitude.
C) there is a negative relationship between amount of study and test performance.
D) None of these are correct.
A) the amount of study time by a student has no effect on test scores.
B) hours of study and test performance are both influenced by a third variable, scholastic aptitude.
C) there is a negative relationship between amount of study and test performance.
D) None of these are correct.
Unlock Deck
Unlock for access to all 121 flashcards in this deck.
Unlock Deck
k this deck
72
Cohen's guidelines describe a correlation of +.50 as
A) small.
B) medium.
C) large.
A) small.
B) medium.
C) large.
Unlock Deck
Unlock for access to all 121 flashcards in this deck.
Unlock Deck
k this deck
73
A researcher uses several different measures in an attempt to predict completion of a doctoral degree in the School of Education.What type of correlational analysis would be most appropriate to predict this criterion?
A) Discriminant analysis
B) Factor analysis
C) Multiple regression
D) Canonical correlation
E) Path analysis
A) Discriminant analysis
B) Factor analysis
C) Multiple regression
D) Canonical correlation
E) Path analysis
Unlock Deck
Unlock for access to all 121 flashcards in this deck.
Unlock Deck
k this deck
74
Statistical significance of a correlation tells us
A) whether it is useful in a practical situation.
B) whether it is useful for predicting a criterion.
C) how much variance the measures have in common.
D) how likely it is that the observed correlation is only a function of chance.
A) whether it is useful in a practical situation.
B) whether it is useful for predicting a criterion.
C) how much variance the measures have in common.
D) how likely it is that the observed correlation is only a function of chance.
Unlock Deck
Unlock for access to all 121 flashcards in this deck.
Unlock Deck
k this deck
75
Would a correlation of -.50 be described in the same way?
A) yes
B) no
A) yes
B) no
Unlock Deck
Unlock for access to all 121 flashcards in this deck.
Unlock Deck
k this deck
76
Exhibit 13-5.Choose the type of correlational statistic that would be used for each of the purposes listed.
Refer to Exhibit 13-5.Used to determine the relationship between several independent variables and several dependent variables.
A) Product-moment correlation
B) Partial correlation
C) Factor analysis
D) Canonical correlation
E) Multiple regression
Refer to Exhibit 13-5.Used to determine the relationship between several independent variables and several dependent variables.
A) Product-moment correlation
B) Partial correlation
C) Factor analysis
D) Canonical correlation
E) Multiple regression
Unlock Deck
Unlock for access to all 121 flashcards in this deck.
Unlock Deck
k this deck
77
Exhibit 13-7: Choose the index of correlation appropriate for use in each of the following.
Exhibit
Refer to Exhibit 13-7.Aptitude test scores and GPA
A) Spearman rho
B) Pearson's r
C) Phi coefficient
Exhibit
Refer to Exhibit 13-7.Aptitude test scores and GPA
A) Spearman rho
B) Pearson's r
C) Phi coefficient
Unlock Deck
Unlock for access to all 121 flashcards in this deck.
Unlock Deck
k this deck
78
A researcher wants to hold scholastic aptitude constant when investigating the relationship between need for achievement and actual achievement in the classroom.What statistical procedure should the researcher use?
A) Canonical correlation
B) Spearman rho
C) Partial correlation
D) Multiple correlation
A) Canonical correlation
B) Spearman rho
C) Partial correlation
D) Multiple correlation
Unlock Deck
Unlock for access to all 121 flashcards in this deck.
Unlock Deck
k this deck
79
Exhibit 13-6: A researcher collects the following measures on a sample of college students: scores on the SAT and the ACT, scores on an English composition test, high school class rank, scores on a noncognitive measure, whether or not students successfully completed the first year of college (pass-fail), and their GPA.Choose the statistical procedures that the researcher should use to answer the following questions.
Refer to Exhibit 13-6.What is the correlation between the combination of independent variables and GPA at the end of the freshman year as dependent variable?
A) Partial correlation
B) Factor analysis
C) Multiple regression
D) Discriminant analysis
E) Product-moment correlation
Refer to Exhibit 13-6.What is the correlation between the combination of independent variables and GPA at the end of the freshman year as dependent variable?
A) Partial correlation
B) Factor analysis
C) Multiple regression
D) Discriminant analysis
E) Product-moment correlation
Unlock Deck
Unlock for access to all 121 flashcards in this deck.
Unlock Deck
k this deck
80
Exhibit 13-6: A researcher collects the following measures on a sample of college students: scores on the SAT and the ACT, scores on an English composition test, high school class rank, scores on a noncognitive measure, whether or not students successfully completed the first year of college (pass-fail), and their GPA.Choose the statistical procedures that the researcher should use to answer the following questions.
Refer to Exhibit 13-6.What is the correlation between the noncognitive measure and college GPA after the influence of SAT on both variables has been removed?
A) Partial correlation
B) Factor analysis
C) Multiple regression
D) Discriminant analysis
E) Product-moment correlation
Refer to Exhibit 13-6.What is the correlation between the noncognitive measure and college GPA after the influence of SAT on both variables has been removed?
A) Partial correlation
B) Factor analysis
C) Multiple regression
D) Discriminant analysis
E) Product-moment correlation
Unlock Deck
Unlock for access to all 121 flashcards in this deck.
Unlock Deck
k this deck
Unlock Deck
Unlock for access to all 121 flashcards in this deck.


