In the graph shown here, the dashed line shows the level of mRNA for a certain protein, Prot7, at various positions along the anterior-posterior axis of an insect embryo. The solid lines portray the levels of two regulatory proteins, A and B, that control translation of the Prot7 mRNA. 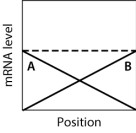 If both A and B stimulate translation of the Prot7 mRNA, then which graph BEST approximates the expected level of Prot7 across the embryo?
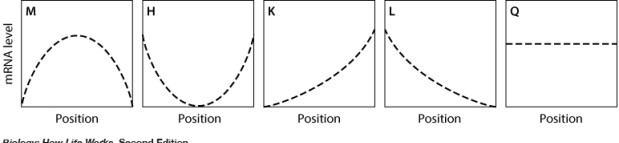
A) graph M
B) graph H
C) graph K
D) graph L
E) graph Q
Correct Answer:
Verified
Q63: The Bithorax mutation in Drosophila results in
Q64: In Drosophila, absence of Bicoid protein results
Q65: In the graph shown here, the dashed
Q66: A new mutation is discovered in Drosophila
Q67: In the graph shown here, the dashed
Q69: Gene regulation during development is _, which
Q70: Maternal-effect genes:
A)are expressed by the mother.
B)affect maternal
Q71: Therapies using stem cells are already used
Q72: In the graph shown here, the dashed
Q73: In the graph shown here, the dashed
Unlock this Answer For Free Now!
View this answer and more for free by performing one of the following actions

Scan the QR code to install the App and get 2 free unlocks

Unlock quizzes for free by uploading documents