In the graph shown here, the dashed line shows the level of mRNA for a certain protein, Prot5, at various positions along the anterior-posterior axis of an insect embryo. The solid line represents the level of a regulatory protein that controls translation of the Prot5 mRNA. 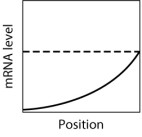 If the regulatory protein represses translation of the Prot5 mRNA, then which graph shows the expected level of Prot5 across the embryo?
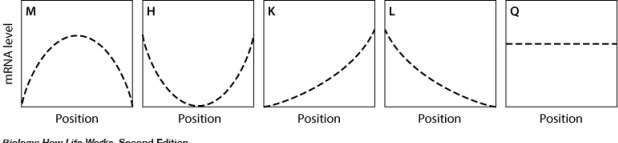
A) graph M
B) graph H
C) graph K
D) graph L
E) graph Q
Correct Answer:
Verified
Q68: In the graph shown here, the dashed
Q69: Gene regulation during development is _, which
Q70: Maternal-effect genes:
A)are expressed by the mother.
B)affect maternal
Q71: Therapies using stem cells are already used
Q72: In the graph shown here, the dashed
Q74: In fruit flies (Drosophila), an embryo during
Q75: In a Drosophila oocyte, bicoid mRNA produced
Q76: Which of the following CORRECTLY orders the
Q77: Why does a mutation in a maternal-effect
Q78: Bicoid protein is a transcription factor that
Unlock this Answer For Free Now!
View this answer and more for free by performing one of the following actions

Scan the QR code to install the App and get 2 free unlocks

Unlock quizzes for free by uploading documents