Solved

Sketch a Scatter Plot of the Data Shown in the Table

Question 1

Multiple Choice

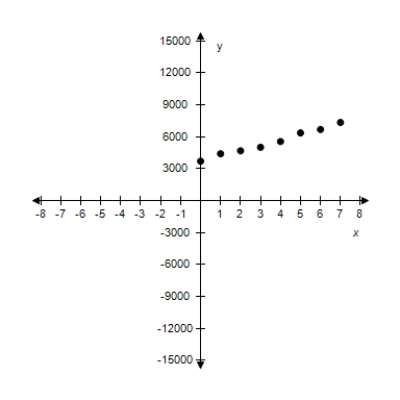
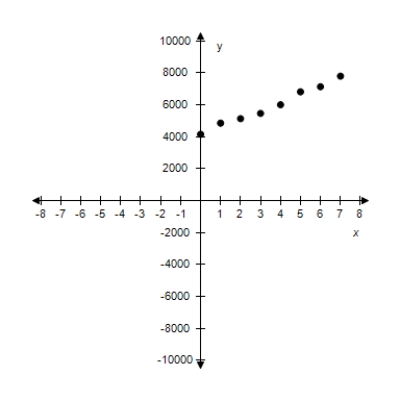
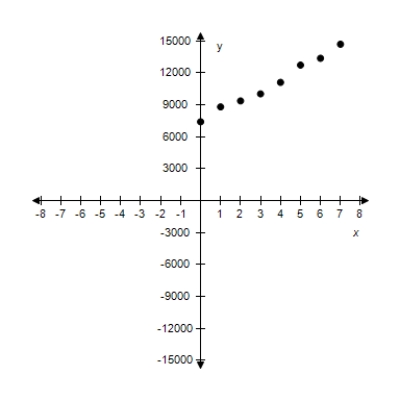
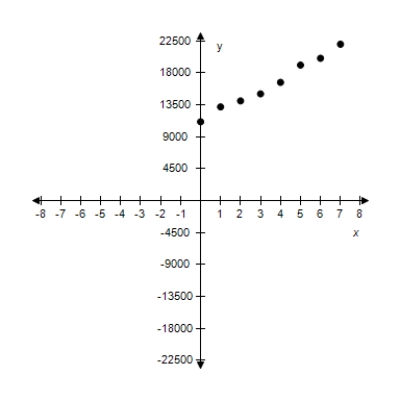
Sketch a scatter plot of the data shown in the table. The table shows the number y of Wal-Mart stores for each year x from 2000 through 2007.
 Year, x Number of stores, y2000370020014400200246802003501020045550200563602006668020077340\begin{array} { | l | l | } \hline \text { Year, } x & \text { Number of stores, } y \\\hline 2000 & 3700 \\\hline 2001 & 4400 \\\hline 2002 & 4680 \\\hline 2003 & 5010 \\\hline 2004 & 5550 \\\hline 2005 & 6360 \\\hline 2006 & 6680 \\\hline 2007 & 7340 \\\hline\end{array}


A) ?  Sketch a scatter plot of the data shown in the table. The table shows the number y of Wal-Mart stores for each year x from 2000 through 2007.  \begin{array} { | l | l | }  \hline \text { Year, } x & \text { Number of stores, } y \\ \hline 2000 & 3700 \\ \hline 2001 & 4400 \\ \hline 2002 & 4680 \\ \hline 2003 & 5010 \\ \hline 2004 & 5550 \\ \hline 2005 & 6360 \\ \hline 2006 & 6680 \\ \hline 2007 & 7340 \\ \hline \end{array}  A) ?   x: Year (0 ? 2000)  Y: Number of stores B) ?   x: Year (0 ? 2000)  Y: Number of stores C) ?   ? X: Year (0 ? 2000)  Y: Number of stores D) ?   x: Year (0 ? 2000)  Y: Number of stores E) ?   x: Year (0 ? 2000)  Y: Number of stores x: Year (0 ? 2000)
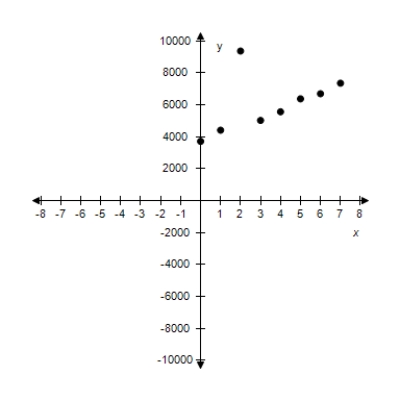
Y: Number of stores
B) ?  Sketch a scatter plot of the data shown in the table. The table shows the number y of Wal-Mart stores for each year x from 2000 through 2007.  \begin{array} { | l | l | }  \hline \text { Year, } x & \text { Number of stores, } y \\ \hline 2000 & 3700 \\ \hline 2001 & 4400 \\ \hline 2002 & 4680 \\ \hline 2003 & 5010 \\ \hline 2004 & 5550 \\ \hline 2005 & 6360 \\ \hline 2006 & 6680 \\ \hline 2007 & 7340 \\ \hline \end{array}  A) ?   x: Year (0 ? 2000)  Y: Number of stores B) ?   x: Year (0 ? 2000)  Y: Number of stores C) ?   ? X: Year (0 ? 2000)  Y: Number of stores D) ?   x: Year (0 ? 2000)  Y: Number of stores E) ?   x: Year (0 ? 2000)  Y: Number of stores x: Year (0 ? 2000)
Y: Number of stores
C) ?  Sketch a scatter plot of the data shown in the table. The table shows the number y of Wal-Mart stores for each year x from 2000 through 2007.  \begin{array} { | l | l | }  \hline \text { Year, } x & \text { Number of stores, } y \\ \hline 2000 & 3700 \\ \hline 2001 & 4400 \\ \hline 2002 & 4680 \\ \hline 2003 & 5010 \\ \hline 2004 & 5550 \\ \hline 2005 & 6360 \\ \hline 2006 & 6680 \\ \hline 2007 & 7340 \\ \hline \end{array}  A) ?   x: Year (0 ? 2000)  Y: Number of stores B) ?   x: Year (0 ? 2000)  Y: Number of stores C) ?   ? X: Year (0 ? 2000)  Y: Number of stores D) ?   x: Year (0 ? 2000)  Y: Number of stores E) ?   x: Year (0 ? 2000)  Y: Number of stores ?
X: Year (0 ? 2000)
Y: Number of stores
D) ?  Sketch a scatter plot of the data shown in the table. The table shows the number y of Wal-Mart stores for each year x from 2000 through 2007.  \begin{array} { | l | l | }  \hline \text { Year, } x & \text { Number of stores, } y \\ \hline 2000 & 3700 \\ \hline 2001 & 4400 \\ \hline 2002 & 4680 \\ \hline 2003 & 5010 \\ \hline 2004 & 5550 \\ \hline 2005 & 6360 \\ \hline 2006 & 6680 \\ \hline 2007 & 7340 \\ \hline \end{array}  A) ?   x: Year (0 ? 2000)  Y: Number of stores B) ?   x: Year (0 ? 2000)  Y: Number of stores C) ?   ? X: Year (0 ? 2000)  Y: Number of stores D) ?   x: Year (0 ? 2000)  Y: Number of stores E) ?   x: Year (0 ? 2000)  Y: Number of stores x: Year (0 ? 2000)
Y: Number of stores
E) ?  Sketch a scatter plot of the data shown in the table. The table shows the number y of Wal-Mart stores for each year x from 2000 through 2007.  \begin{array} { | l | l | }  \hline \text { Year, } x & \text { Number of stores, } y \\ \hline 2000 & 3700 \\ \hline 2001 & 4400 \\ \hline 2002 & 4680 \\ \hline 2003 & 5010 \\ \hline 2004 & 5550 \\ \hline 2005 & 6360 \\ \hline 2006 & 6680 \\ \hline 2007 & 7340 \\ \hline \end{array}  A) ?   x: Year (0 ? 2000)  Y: Number of stores B) ?   x: Year (0 ? 2000)  Y: Number of stores C) ?   ? X: Year (0 ? 2000)  Y: Number of stores D) ?   x: Year (0 ? 2000)  Y: Number of stores E) ?   x: Year (0 ? 2000)  Y: Number of stores x: Year (0 ? 2000)
Y: Number of stores

Correct Answer:

verifed

Verified

Related Questions

Unlock this Answer For Free Now!

View this answer and more for free by performing one of the following actions

qr-code

Scan the QR code to install the App and get 2 free unlocks

upload documents

Unlock quizzes for free by uploading documents