Use the following to answer questions
Scenario I
Examine Figure 2.1 and then answer the following questions. 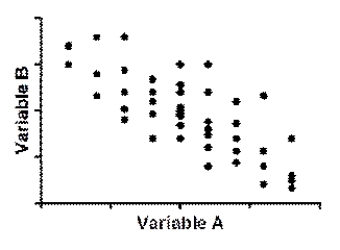
-(Scenario I) Each data point on the scatterplot represents:
A) a single participant's score on variables A and B
B) a single participant's score on variable B
C) the score on variable B at the group mean of variable A
D) the score on variable A at the group mean of variable B
Correct Answer:
Verified
Q3: Use the following to answer questions
Scenario
Q4: Use the following to answer questions
Scenario
Q5: Use the following to answer questions
Scenario
Q6: Use the following to answer questions
Scenario
Q7: Use the following to answer questions
Scenario
Q8: Use the following to answer questions
Scenario
Q9: Use the following to answer questions
Scenario
Q10: Use the following to answer questions
Scenario
Q11: Use the following to answer questions
Scenario
Q12: Use the following to answer questions
Scenario
Unlock this Answer For Free Now!
View this answer and more for free by performing one of the following actions

Scan the QR code to install the App and get 2 free unlocks

Unlock quizzes for free by uploading documents