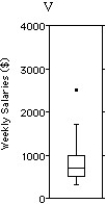
Shown below are the histogram and summary statistics for the weekly salaries (in dollars) of 24 randomly selected employees of a company: 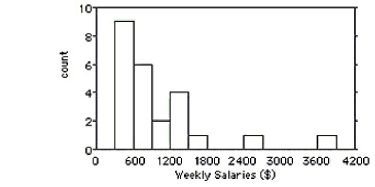 Choose the boxplot that represents the given data.
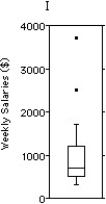

A) I
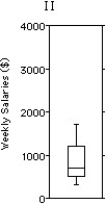
B) II
C) III
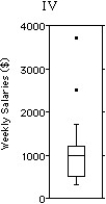
D) IV
E) V
Correct Answer:
Verified
Q87: During student-teacher negotiations at a certain high
Q88: Here are the commutes (in kilometres)for a
Q89: The weekly salaries (in dollars)of 24
Q90: Here are the average mathematics achievement
Q91: Which set has the largest standard
Q93: Shown below are the boxplot and
Q94: The ages of the 21 members of
Q95: Shown below are the boxplot and the
Q96: Shown below are the boxplot and the
Q97: Shown below are the boxplot and the
Unlock this Answer For Free Now!
View this answer and more for free by performing one of the following actions

Scan the QR code to install the App and get 2 free unlocks

Unlock quizzes for free by uploading documents