Shown below are the boxplot and the histogram for the highest temperatures ever recorded (in °F) in 32 different states in the U.S.A. 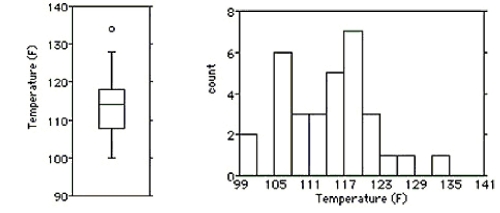
i) What features of the distribution can you see in both the histogram and the boxplot?
ii) What features of the distribution can you see in the histogram that you could not see in the boxplot?
A) i) The distribution is highly skewed to the right,with two outliers at 128°F and 134°F.Most high temperatures are between 105°F and 129°F. ii) When looking at the histogram,the distribution appears to be bimodal.This is not obvious from the boxplot.
B) i) The distribution is highly skewed to the left,with an outlier at 134°F.Most high temperatures are between 108°F and 130°F. ii) When looking at the histogram,the distribution appears to be bimodal.This is not obvious from the boxplot.
C) i) The distribution is fairly symmetric,with no outliers.Most high temperatures are between 99°F and 117°F. ii) When looking at the histogram,the distribution appears to be bimodal.This is not obvious from the boxplot.
D) i) The distribution is highly skewed to the right,with an outlier at 134°F.Most high temperatures are between 105°F and 129°F. ii) When looking at the histogram,the distribution appears to be bimodal.This is not obvious from the boxplot.
E) i) The distribution is fairly symmetric,with an outlier at 134°F (although this value is only obvious from the boxplot) .Most high temperatures are between 107°F and 118°F. ii) When looking at the histogram,the distribution appears to be bimodal.This is not obvious from the boxplot.
Correct Answer:
Verified
Q91: Which set has the largest standard
Q92: Shown below are the histogram and
Q93: Shown below are the boxplot and
Q94: The ages of the 21 members of
Q95: Shown below are the boxplot and the
Q97: Shown below are the boxplot and the
Q98: A sewing supply company has a
Q99: Here are the prices for 8 different
Q100: The following data consists of the
Q101: Here are the average mathematics achievement
Unlock this Answer For Free Now!
View this answer and more for free by performing one of the following actions

Scan the QR code to install the App and get 2 free unlocks

Unlock quizzes for free by uploading documents