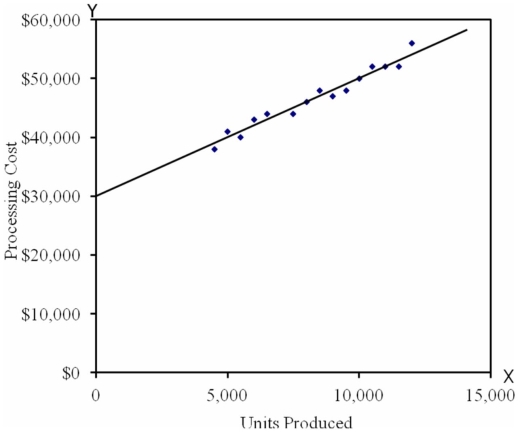
The graph below was produced after recording the processing costs of Oki Products observed over the last 10 months using the following data: 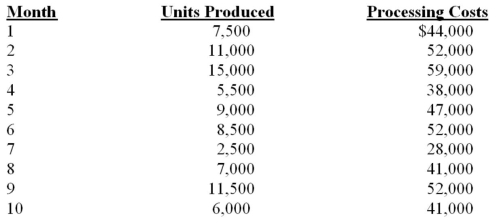
Required:
a.Using the graph identify the monthly fixed costs.What additional information might you determine from the graph?
b.The chart above indicates total processing costs of $47,000 at a level of 9,000 units for month 5.Using this level of activity and your fixed costs determined in a,calculate the variable cost per unit to the nearest cent.Express your results in the form of a linear equation y = a + bx.
c.Use the high low method to determine the variable cost per unit and fixed cost per month.Express your results in the form of a linear equation y = a + bx.
d.Comment on the differences between the results in b and c.Which result would you consider more accurate and why?
Correct Answer:
Verified
View Answer
Unlock this answer now
Get Access to more Verified Answers free of charge
Q85: The "goodness of fit" statistic (that is,R-squared)associated
Q86: The contribution approach to constructing an income
Q94: Because the least-squares regression method is more
Q96: The 4 x 4 Shop is a
Q97: Mateo Company's average cost per unit is
Q101: The cost structure of Sackville Manufacturing Company
Q102: (Appendix 3A)Jenson Manufacturing is developing cost formula
Q103: (Appendix 3A)Below are cost and activity data
Q105: The following is Allison Corporation's contribution format
Q108: Suppose a firm reports the following results
Unlock this Answer For Free Now!
View this answer and more for free by performing one of the following actions

Scan the QR code to install the App and get 2 free unlocks

Unlock quizzes for free by uploading documents