In the figure given below,the curve TT shows how the allocation of a resource affects the well-being of two individuals,Hank and Monica. 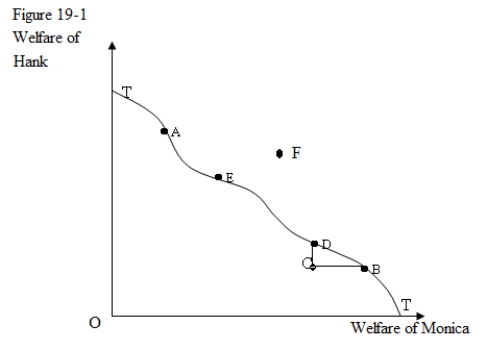
-In Figure 19-1,the curve TT shows:
A) a single and unique distribution of resources that jointly maximizes Hank's and Monica's well-being.
B) all the efficient resource allocations that are attainable.
C) all the points where the marginal rates of substitution between goods are equal for both Hank and Monica.
D) all the points that maximize the individual well-being of Hank and Monica.
Correct Answer:
Verified
Q21: Which of the following statements about the
Q25: A comparison between the resource allocation at
Q27: Which of the following is not one
Q29: An exchange of goods between two individuals,Frank
Q30: When the allocation of two goods between
Q35: In the figure given below,the curve TT
Q36: In the figure given below,the curve TT
Q40: Assume that Bill and Terry consume two
Q56: A point off the contract curve in
Q58: In an Edgeworth production box diagram,if two
Unlock this Answer For Free Now!
View this answer and more for free by performing one of the following actions

Scan the QR code to install the App and get 2 free unlocks

Unlock quizzes for free by uploading documents