In the figure given below,the curve TT shows how the allocation of a resource affects the well-being of two individuals,Hank and Monica. 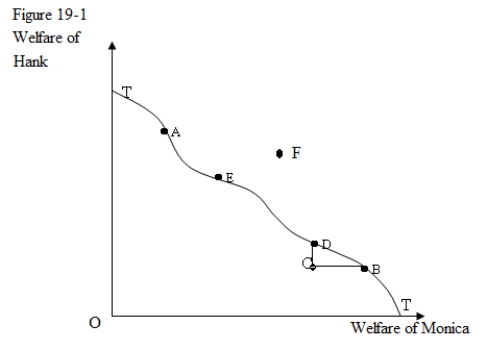
-Refer to Figure 19-1.Which of the following would represent a movement from an inefficient allocation of resources to an efficient allocation of resources?
A) A movement from point E to point A
B) A movement from point C to point B
C) A movement from point B to point D
D) A movement from point A to point B
Correct Answer:
Verified
Q21: Which of the following statements about the
Q25: A comparison between the resource allocation at
Q27: Which of the following is not one
Q28: Any two goods are said to be
Q29: An exchange of goods between two individuals,Frank
Q30: When the allocation of two goods between
Q30: In the figure given below,the curve TT
Q36: In the figure given below,the curve TT
Q37: In the figure given below,the curve TT
Q40: Assume that Bill and Terry consume two
Unlock this Answer For Free Now!
View this answer and more for free by performing one of the following actions

Scan the QR code to install the App and get 2 free unlocks

Unlock quizzes for free by uploading documents