A student in an AP Statistics class decided to conduct a study to determine whether you could predict the number of followers a teen has on Instagram based on the number of people he or she is following. To do this, she randomly selected fifty students from her high school that had Instagram accounts and for each student recorded the number of people they were following and the number of followers they had. A scatterplot of the data is shown.
The regression line is
.
followers=-45.3+1.21(following) 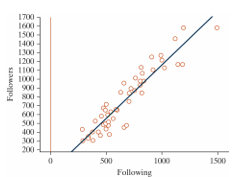
-A 95% confidence interval for the population slope is (1.07, 1.35) . How would you interpret this in the context of the study?
A) We are 95% confident that the population slope is between 1.07 and 1.35.
B) If we repeated this study many times, 95% of the regression slopes would fall between 1.07 and 1.35.
C) There is a 95% probability that the population slope is between 1.07 and 1.35.
D) We are 95% confident that a one person increase in the number of people one is following on Instagram is associated with between a 1.07 to 1.35 person increase in the number of followers.
E) Both A and D
F) Both A and B
G) Both B and C
Correct Answer:
Verified
Q63: Data from gapminder.org on 184 countries was
Q64: Data from gapminder.org on 184 countries was
Q65: Data from gapminder.org on 184 countries was
Q66: Data from gapminder.org on 184 countries was
Q67: Data from gapminder.org on 184 countries was
Q68: How is the number of pages in
Q69: How is the number of pages in
Q70: How is the number of pages in
Q71: A student in an AP Statistics class
Q72: A student in an AP Statistics class
Unlock this Answer For Free Now!
View this answer and more for free by performing one of the following actions

Scan the QR code to install the App and get 2 free unlocks

Unlock quizzes for free by uploading documents