Data from gapminder.org on 184 countries was used to examine if there is an association between (average) female life expectancy (that is, the average lifespan of women in the country) and the average number of children women give birth to for the year 2019. A scatterplot of the data follows. 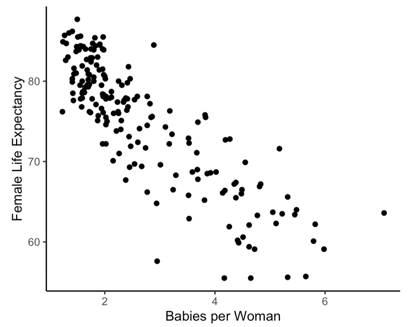
-Below is a picture of a simulated null distribution of correlation coefficients created using the Corr/Regression applet. How would you use this distribution to calculate the p-value? 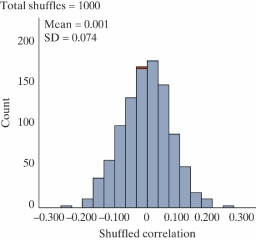
A) Find the proportion of simulated correlation coefficients greater than zero.
B) Find the proportion of simulated correlation coefficients as far away from zero or further than the one observed.
C) Find the proportion of simulated correlation coefficients as small or smaller than the one observed.
D) Find the proportion of simulated correlation coefficients as large or larger than the one observed.
Correct Answer:
Verified
Q20: Are people with bigger brains more intelligent?
Q21: Data from gapminder.org on 184 countries was
Q22: Data from gapminder.org on 184 countries was
Q23: Data from gapminder.org on 184 countries was
Q24: Data from gapminder.org on 184 countries was
Q26: Data from gapminder.org on 184 countries was
Q27: The following scatterplot displays the finish time
Q28: The following scatterplot displays the finish time
Q29: The following scatterplot displays the finish time
Q30: The following scatterplot displays the finish time
Unlock this Answer For Free Now!
View this answer and more for free by performing one of the following actions

Scan the QR code to install the App and get 2 free unlocks

Unlock quizzes for free by uploading documents