(Figure: Natural Rate) What does the figure represent?
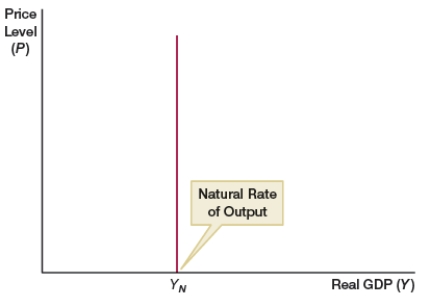
A) long-run aggregate demand curve
B) short-run aggregate demand curve
C) long-run aggregate supply curve
D) short-run aggregate supply curve
Correct Answer:
Verified
Q5: When aggregate demand declines, an economy will
Q6: If Econia's aggregate demand falls, the price
Q7: (Figure: ASAD0) In the figure, in the
Q8: (Figure: ASAD0) In the figure, the price
Q9: The slope of the long-run aggregate supply
Q11: In the long run, total national output:
A)
Q12: Why does the amount of national output
Q13: What determines national output on the long-run
Q14: How is economic growth shown on a
Q15: Which of the following would NOT shift
Unlock this Answer For Free Now!
View this answer and more for free by performing one of the following actions

Scan the QR code to install the App and get 2 free unlocks

Unlock quizzes for free by uploading documents