(Figure: ASAD0) In the figure, the price level went from 100 to 76. This suggests the economy was experiencing a(n) :
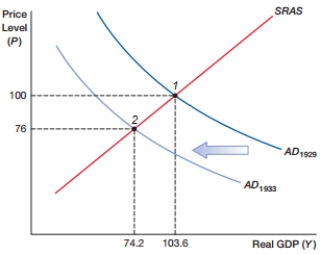
A) inflationary recession
B) inflationary expansion
C) deflationary recession
D) deflationary expansion
Correct Answer:
Verified
Q3: A sudden and large shift in an
Q4: Aggregate demand is the:
A) total demand for
Q5: When aggregate demand declines, an economy will
Q6: If Econia's aggregate demand falls, the price
Q7: (Figure: ASAD0) In the figure, in the
Q9: The slope of the long-run aggregate supply
Q10: (Figure: Natural Rate) What does the figure
Q11: In the long run, total national output:
A)
Q12: Why does the amount of national output
Q13: What determines national output on the long-run
Unlock this Answer For Free Now!
View this answer and more for free by performing one of the following actions

Scan the QR code to install the App and get 2 free unlocks

Unlock quizzes for free by uploading documents