True/False
The table below illustrates a set of data for a function.
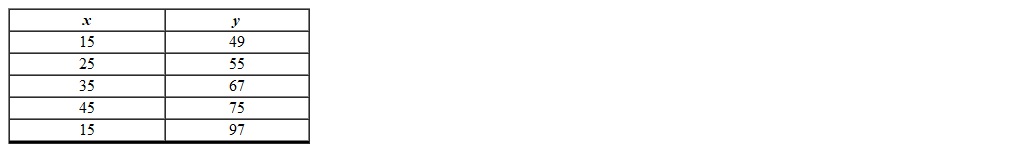
Correct Answer:
Verified
Related Questions
Q4: The graph of f(x) = -8 is
Q7: All relations are functions.
Q9: The table below illustrates a set of
Q12: If the net change of a function
Q13: A table of values is an example
Q15: The table below describes the average temperatures
Q16: The table below describes the average temperatures
Q17: The relation Q18: If your quiz scores for MAT 101 Q18: The price per gallon of gas at![]()
Unlock this Answer For Free Now!
View this answer and more for free by performing one of the following actions

Scan the QR code to install the App and get 2 free unlocks

Unlock quizzes for free by uploading documents