True/False
The table below illustrates a set of data for a function. 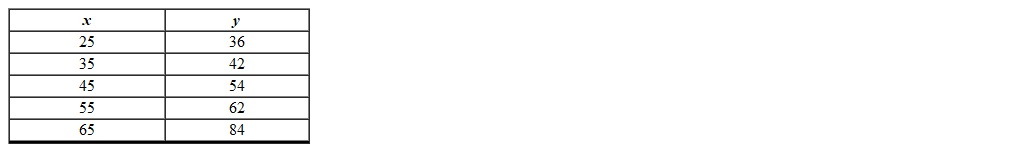
Correct Answer:
Verified
Related Questions
Q3: A variable y is a function of
Q4: The price per gallon of gas at
Q4: The graph of f(x) = -8 is
Q7: The table below gives the cost for
Q7: All relations are functions.
Q11: If the temperatures over a 12-hour period
Q12: If the net change of a function
Q13: A table of values is an example
Q13: The table below illustrates a set of
Q18: If your quiz scores for MAT 101
Unlock this Answer For Free Now!
View this answer and more for free by performing one of the following actions

Scan the QR code to install the App and get 2 free unlocks

Unlock quizzes for free by uploading documents