Exhibit 1A-10 Multi-curve graph 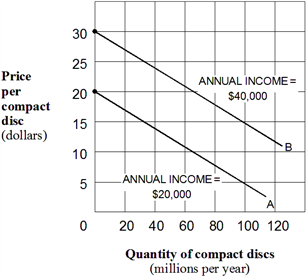 Exhibit 1A-10 represents a three-variable relationship. As the annual income of consumers rises from $20,000 (line A) to $40,000 (line B) , the result is a(n) :
A) rightward movement along each curve.
B) leftward movement along each curve.
C) leftward shift in curve B to curve A.
D) leftward shift in curve A to curve B.
Correct Answer:
Verified
Q51: A two-dimensional graph can only represent the
Q52: Exhibit 1A-8 Straight line relationship Q54: Exhibit 1A-7 Straight line relationship Q56: Exhibit 1A-8 Straight line relationship Q57: Exhibit 1A-8 Straight line relationship Q60: Exhibit 1A-9 Multi-curve graph Q221: The graph of a direct relationship will Q231: Direct relationships are illustrated using upward-sloping lines Q232: Exhibit 1A-6 Straight line Q247: An upward-sloping straight line exhibits a direct Unlock this Answer For Free Now! View this answer and more for free by performing one of the following actions Scan the QR code to install the App and get 2 free unlocks Unlock quizzes for free by uploading documents![]()
![]()
![]()
![]()
![]()
![]()

