Multiple Choice
Exhibit 1A-9 Multi-curve graph 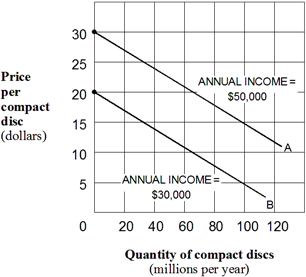 Exhibit 1A-9 represents a three-variable relationship. As the annual income of consumers falls from $50,000 (line A) to $30,000 (line B) , the result is a(n) :
A) rightward movement along each curve.
B) leftward movement along each curve.
C) leftward shift in curve A to curve B.
D) rightward shift in curve A to curve B.
Correct Answer:
Verified
Related Questions
Q7: When economists say scarcity, they mean:
A) there
Q9: Scarcity:
A) exists because resources are unlimited while

