The figure given below depicts long run equilibrium in an aggregate demand-aggregate supply model. Which of these could have caused the movement shown in this figure?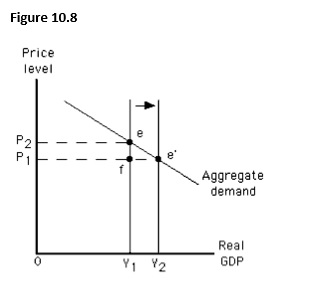
A) A decrease in the size of the labor force
B) An increase in the price level
C) An increase in net investment
D) An increase in autonomous consumption
E) A decrease in autonomous consumption
Correct Answer:
Verified
Q88: If resource prices are "sticky" downward and
Q99: The figure below shows the determination of
Q100: The figure below shows the determination of
Q101: The figure given below depicts long run
Q102: Which of the following is most likely
Q103: The main effect of a decrease in
Q104: The figure given below depicts long run
Q115: Which of these is most likely to
Q118: In the long run,a leftward shift of
Q119: Which of these is not a beneficial
Unlock this Answer For Free Now!
View this answer and more for free by performing one of the following actions

Scan the QR code to install the App and get 2 free unlocks

Unlock quizzes for free by uploading documents