The figure below shows the determination of the equilibrium price level and real GDP in an aggregate demand-aggregate supply model. The movement shown in this figure is most likely to be caused by: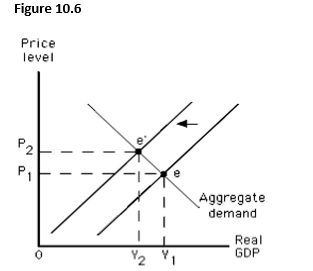
A) a decrease in the real wage.
B) an increase in the economy's capital stock.
C) the actions of a labor union.
D) a decrease in consumer spending.
E) an increase in labor productivity.
Correct Answer:
Verified
Q82: Which of the following is true when
Q86: Which of the following is true of
Q87: Which of these is an advantage of
Q88: If resource prices are "sticky" downward and
Q99: The figure below shows the determination of
Q101: The figure given below depicts long run
Q102: Which of the following is most likely
Q103: The figure given below depicts long run
Q104: The figure given below depicts long run
Q118: In the long run,a leftward shift of
Unlock this Answer For Free Now!
View this answer and more for free by performing one of the following actions

Scan the QR code to install the App and get 2 free unlocks

Unlock quizzes for free by uploading documents