Use the REGRESSION feature on a graphing calculator.
-A study was conducted to compare the average time spent in the lab each week versus course grade for computer students. The results are recorded in the table below. 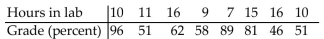 Use linear regression to find a linear function that predicts a student's course grade as a function of the number of hours
Spent in lab.
A) y = 0.930 + 44.3x
B) y = 88.6 - 1.86x
C) y = 44.3 + 0.930x
D) y = 1.86 + 88.6x
Correct Answer:
Verified
Q104: Solve graphically to two decimal places using
Q105: Use the REGRESSION feature on a graphing
Q106: Solve the equation graphically to four decimal
Q107: Solve the problem.
-Under certain conditions, the power
Q108: Solve the problem.
-The U. S. Census Bureau
Q110: Solve the equation graphically to four decimal
Q111: Solve the problem.
-The mathematical model C =
Q112: Solve the problem. Q113: Use the REGRESSION feature on a graphing Q114: Solve the problem.
-The polynomial ![]()
-In economics, functions that involve
Unlock this Answer For Free Now!
View this answer and more for free by performing one of the following actions

Scan the QR code to install the App and get 2 free unlocks

Unlock quizzes for free by uploading documents