Use the REGRESSION feature on a graphing calculator.
-The use of bottled water in the United States has shown a steady increase in recent years. The table shows the annual per capita consumption for the years 1995 - 2001. 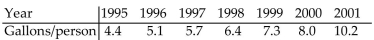 With x being the years since 1995, find the linear function that represents this data. Round your answer to two decimal
Places.
A) y = 4.07x + 0.89
B) 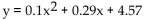
C) 
D) y = 0.89x + 4.07
Correct Answer:
Verified
Q100: Provide an appropriate response.
-Use the graph to
Q101: Solve the problem.
-The cost of manufacturing a
Q102: Solve the problem.
-The cost for labor associated
Q103: Use the REGRESSION feature on a graphing
Q104: Solve graphically to two decimal places using
Q106: Solve the equation graphically to four decimal
Q107: Solve the problem.
-Under certain conditions, the power
Q108: Solve the problem.
-The U. S. Census Bureau
Q109: Use the REGRESSION feature on a graphing
Q110: Solve the equation graphically to four decimal
Unlock this Answer For Free Now!
View this answer and more for free by performing one of the following actions

Scan the QR code to install the App and get 2 free unlocks

Unlock quizzes for free by uploading documents