Solve the problem.
-The following data set gives the average home value, in dollars, for a city at 5 -year intervals.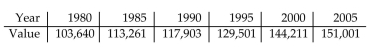
In which 5 -year period did average home value change the most?
A) 2000-2005
B)
C)
D)
Correct Answer:
Verified
Q3: Match the numerical model to the
Q4: Match the numerical model to the
Q5: Solve the problem.
-The graph depicts a
Q6: Solve the problem.
-The following data set
Q7: Match the numerical model to the corresponding
Q9: Match the numerical model to the
Q10: Solve the problem.
-The graph shows the
Q11: Solve the problem.
-Some of the results
Q12: Match the numerical model to the
Q13: Solve the problem.
-The following data set
Unlock this Answer For Free Now!
View this answer and more for free by performing one of the following actions

Scan the QR code to install the App and get 2 free unlocks

Unlock quizzes for free by uploading documents