Solve the problem.
-The following data set gives the average home value, in dollars, for a city at 5 -year intervals.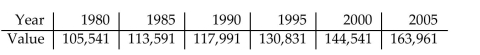
Determine where is increasing or decreasing.
A) is decreasing for the given values.
B) is increasing for the given -values.
C) is constant for the given -values.
D) is increasing until 1980, then is decreasing for remainder of -values.
Correct Answer:
Verified
Q8: Solve the problem.
-The following data set
Q9: Match the numerical model to the
Q10: Solve the problem.
-The graph shows the
Q11: Solve the problem.
-Some of the results
Q12: Match the numerical model to the
Q14: Match the numerical model to the
Q15: Match the numerical model to the
Q16: Solve the problem.
-A rock is thrown
Q17: Solve the problem.
-Some of the results of
Q18: Match the numerical model to the
Unlock this Answer For Free Now!
View this answer and more for free by performing one of the following actions

Scan the QR code to install the App and get 2 free unlocks

Unlock quizzes for free by uploading documents