Describe the shape of the distribution.
-A histogram for the sale prices of homes sold in one city during last year is shown below.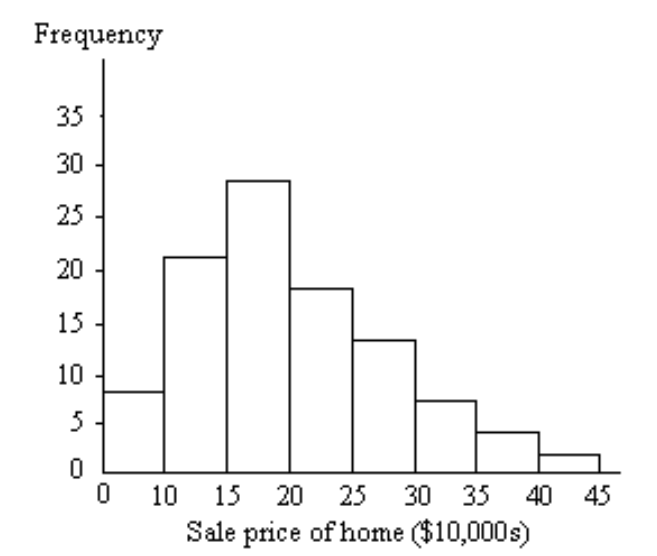
A) Left skewed, unimodal
B) Right skewed, unimodal
C) Bimodal
D) Symmetric, unimodal
Correct Answer:
Verified
Q44: Identify whether the number described is a
Q45: Describe the shape of the distribution.
-A stemplot
Q46: Identify whether the number described is a
Q47: Eleven dimes dated 1989 through 1999 are
Q48: Identify whether the number described is a
Q50: Identify whether the average described is a
Q51: Solve the problem.
-A sample of 350 students
Q52: Eleven dimes dated 1989 through 1999 are
Q53: Describe the shape of the distribution.
-A histogram
Q54: Identify whether the average described is a
Unlock this Answer For Free Now!
View this answer and more for free by performing one of the following actions

Scan the QR code to install the App and get 2 free unlocks

Unlock quizzes for free by uploading documents