Solve the problem.
-A sample of 350 students was selected and each was asked the make of their automobile (foreign or domestic) and their year in college (freshman, sophomore, junior, or senior) . The results are shown in the table below.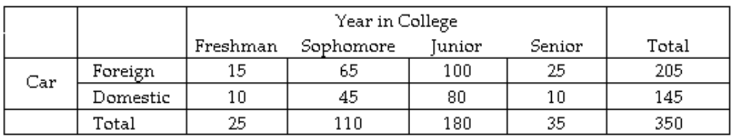
What percent of seniors drive a domestic automobile?
A) 71.4%
B) 28.6%
C) 7.3%
D) 4.3%
Correct Answer:
Verified
Q46: Identify whether the number described is a
Q47: Eleven dimes dated 1989 through 1999 are
Q48: Identify whether the number described is a
Q49: Describe the shape of the distribution.
-A histogram
Q50: Identify whether the average described is a
Q52: Eleven dimes dated 1989 through 1999 are
Q53: Describe the shape of the distribution.
-A histogram
Q54: Identify whether the average described is a
Q55: Describe the shape of the distribution.
-A histogram
Q56: Identify whether the average described is a
Unlock this Answer For Free Now!
View this answer and more for free by performing one of the following actions

Scan the QR code to install the App and get 2 free unlocks

Unlock quizzes for free by uploading documents