The following graph of a time-series data suggests a ___ trend. 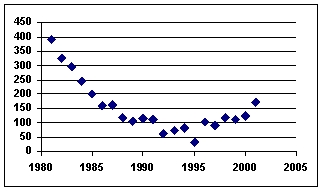
A) linear
B) tangential
C) cosine
D) quadratic
E) flat
Correct Answer:
Verified
Q54: Analysis of data for an autoregressive forecasting
Q55: Analysis of data for an autoregressive forecasting
Q56: Calculating the "ratios of actuals to moving
Q56: The ratios of "actuals to moving averages"
Q57: Analysis of data for an autoregressive forecasting
Q60: Using a three-month moving average, the forecast
Q61: Using 2019 as the base year, the
Q62: When constructing a weighted aggregate price index,
Q63: Using 2016 as the base year, the
Q67: Weighted aggregate price indexes are also known
Unlock this Answer For Free Now!
View this answer and more for free by performing one of the following actions

Scan the QR code to install the App and get 2 free unlocks

Unlock quizzes for free by uploading documents