The graph below shows the relationship between the temperature (degrees Fahrenheit) inside an oven and the time since the oven was turned off. Find the slope of the line between the two points shown on the graph, namely (20, 275) and (50, 125) . Write a sentence that states the meaning of the slope. 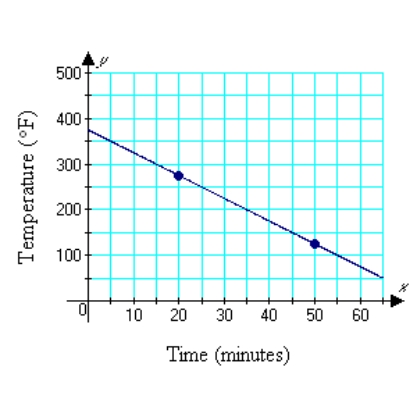
A) m = -5; The temperature of the oven decreases 5 °/min.
B) m = -6; The temperature of the oven decreases 6 °/min.
C) m = 5; The temperature of the oven increases 5 °/min.
D) m = -150; The temperature of the oven decreases 150 °/min.
E) m = 5; The temperature of the oven decreases 5 °/min.
Correct Answer:
Verified
Q41: The graph below shows how the amount
Q42: Graph by using the slope and y-intercept:
Q43: Find the slope of the line containing
Q44: Graph by using the slope and y-intercept:
Q45: The graph below shows the relationship between
Q47: Find the slope of the line containing
Q48: Find the equation of the line that
Q49: Find the equation of the line that
Q50: Graph by using the slope and y-intercept:
Q51: The graph below shows the number of
Unlock this Answer For Free Now!
View this answer and more for free by performing one of the following actions

Scan the QR code to install the App and get 2 free unlocks

Unlock quizzes for free by uploading documents