The graph below shows the relationship between the distance traveled by a motorist and the time of travel. Find the slope of the line between the two points shown on the graph, namely (1, 80) and (3, 240) . Write a sentence that states the meaning of the slope. 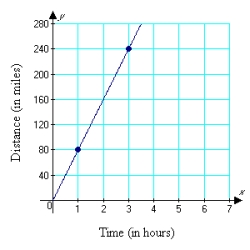
A) m = 80; The distance traveled by the motorist in 2 hours is 80 miles.
B) m = 240; The average speed of the motorist is 240 mph.
C) m = 80; The average speed of the motorist is 80 mph.
D) m = 160; The average speed of the motorist is 160 mph.
E) m = 60; The average speed of the motorist is 60 mph.
Correct Answer:
Verified
Q40: Does the diagram below represent a function?
Q41: The graph below shows how the amount
Q42: Graph by using the slope and y-intercept:
Q43: Find the slope of the line containing
Q44: Graph by using the slope and y-intercept:
Q46: The graph below shows the relationship between
Q47: Find the slope of the line containing
Q48: Find the equation of the line that
Q49: Find the equation of the line that
Q50: Graph by using the slope and y-intercept:
Unlock this Answer For Free Now!
View this answer and more for free by performing one of the following actions

Scan the QR code to install the App and get 2 free unlocks

Unlock quizzes for free by uploading documents