The following pie chart presents the percentages of fish caught in each of four ratings categories. Match this pie chart with its corresponding Pareto chart. 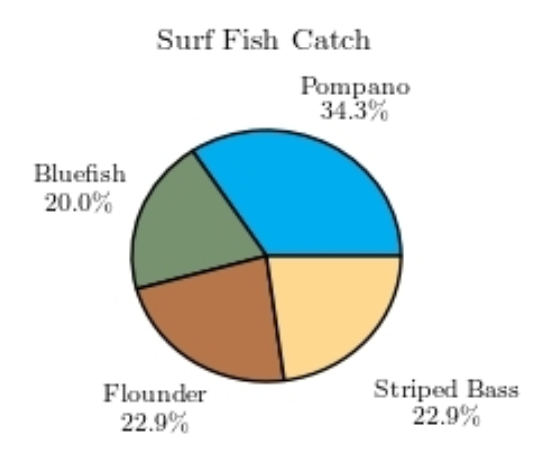
A) 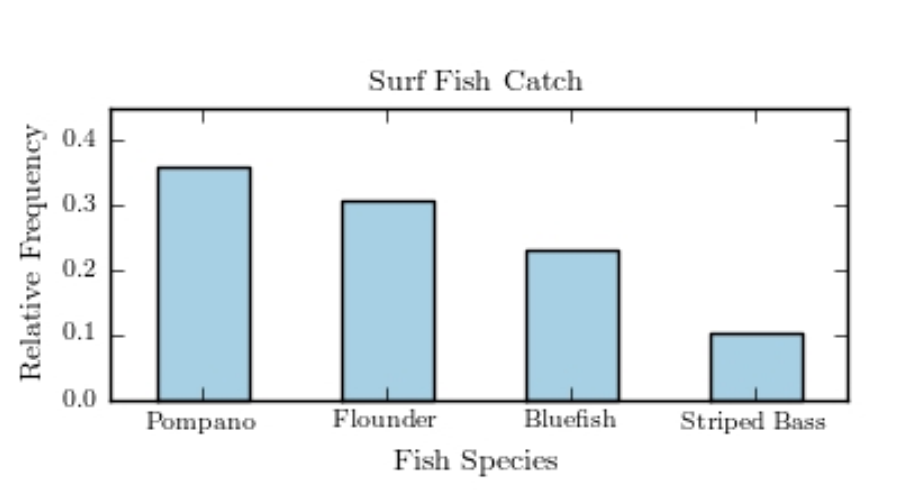
B) 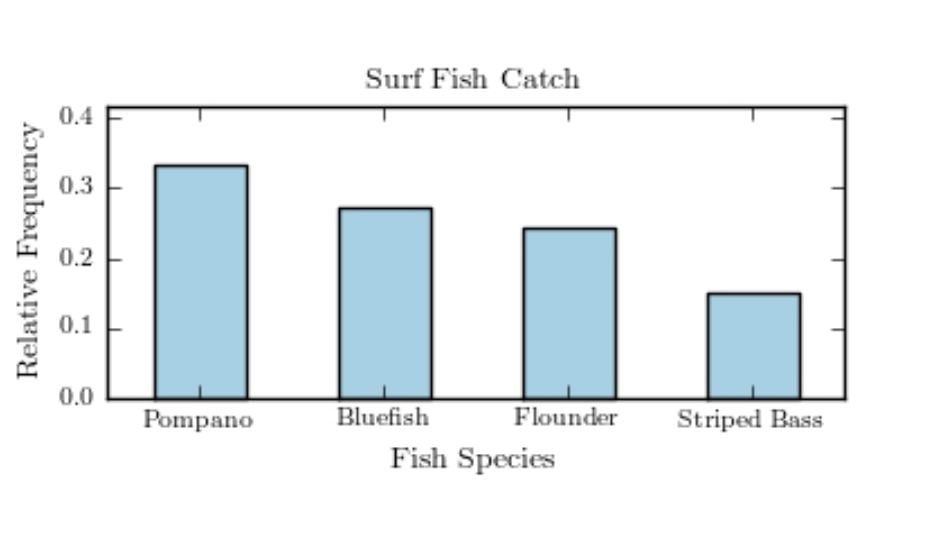
C) 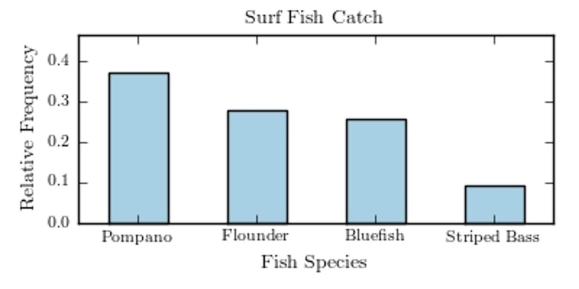
D) 
Correct Answer:
Verified
Q10: The following pie chart presents the percentages
Q11: The following table presents the purchase
Q12: The following frequency distribution presents the
Q13: The following frequency distribution presents the
Q14: Classify the histogram as unimodal or bimodal.
Q16: The following frequency distribution presents the
Q17: The following frequency distribution presents the
Q18: The following table presents the purchase
Q19: Thirty households were surveyed for the
Q20: Following is a pie chart that presents
Unlock this Answer For Free Now!
View this answer and more for free by performing one of the following actions

Scan the QR code to install the App and get 2 free unlocks

Unlock quizzes for free by uploading documents