The following pie chart presents the percentages of fish caught in each of four ratings categories. Match this pie chart with its corresponding bar graph. 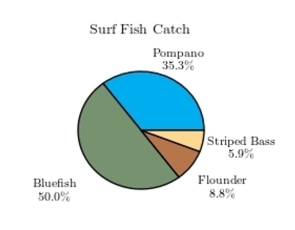
A) 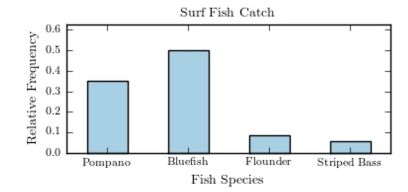
B) 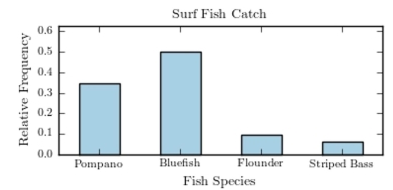
C) 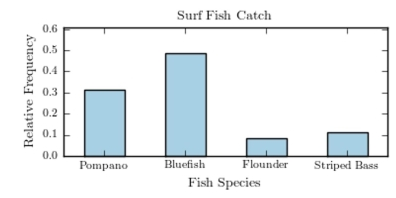
D) 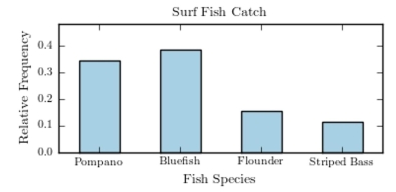
Correct Answer:
Verified
Q5: The following frequency distribution presents the
Q6: The following frequency distribution presents the
Q7: The following frequency distribution presents the
Q8: One hundred students are shown an eight-digit
Q9: The following bar graph presents the average
Q11: The following table presents the purchase
Q12: The following frequency distribution presents the
Q13: The following frequency distribution presents the
Q14: Classify the histogram as unimodal or bimodal.
Q15: The following pie chart presents the percentages
Unlock this Answer For Free Now!
View this answer and more for free by performing one of the following actions

Scan the QR code to install the App and get 2 free unlocks

Unlock quizzes for free by uploading documents