The plot below shows the Residuals vs Fitted Values for the model of predictors Height, Weight, and Chest measurements (all in inches) and response percent body fat (Pct.BF)
Before observation 251 was removed.It was assumed that a typo was made and an extra zero
Was added to the Pct.BF value.Which of the following statements are true? 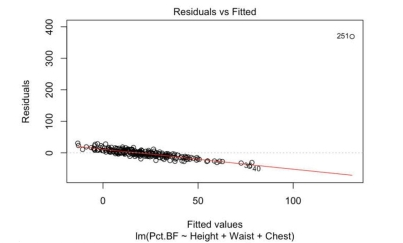
A) After removing observation 251 , The value of will increase.
B) After removing observation 251 , he standard deviations of the residuals will decrease.
C) Observation 251 is clearly a high leverage point.
D) The coefficient of Chest will not change when this point is removed.
E) Making conclusions without plotting the data can be disastrous.
Correct Answer:
Verified
Q2: Selling price and amount spent advertising were
Q3: Selling price and percent of advertising
Q4: Selling price and percent of advertising
Q5: Which of the following statements about partial
Q6: A multiple regression model was used
Q8: In regression an observation has high leverage
Q8: A sample of 33 companies was
Q9: Selling price and percent of advertising budget
Q10: Using the output below, calculate the
Q11: Partial regression plots are useful for which
Unlock this Answer For Free Now!
View this answer and more for free by performing one of the following actions

Scan the QR code to install the App and get 2 free unlocks

Unlock quizzes for free by uploading documents