Use the data provided in the table below to answer the question. The table shows city size and annual grocery expenditures for eight families. City size is in thousands and expenditures is in hundreds of dollars.
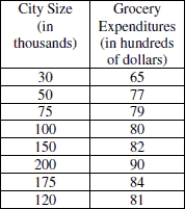
-Suppose each of these families is given a grocery credit of $100, therefore reducing expenditures in the table by one unit (since this variable was recorded in hundreds of dollars). Estimate the new correlation with city size. What happens to the correlation when a constant is added (in this case - 100 dollars is added to each number)? Explain your reasoning.
Correct Answer:
Verified
View Answer
Unlock this answer now
Get Access to more Verified Answers free of charge
Q36: The table shows the number of minutes
Q37: Suppose it has been established that "home
Q38: The data in the table represent the
Q39: Use the following information to answer the
Q40: Use the following information to answer the
Q42: The following regression equation was found to
Q43: Explain in your own words what extrapolation
Q44: Use the following information to answer the
Q45: State the explanatory variable and the response
Q46: If the correlation between whole milk content
Unlock this Answer For Free Now!
View this answer and more for free by performing one of the following actions

Scan the QR code to install the App and get 2 free unlocks

Unlock quizzes for free by uploading documents