The data in the table represent the amount of pressure (psi) exerted by a stamping machine (x) , and the amount of scrap brass shavings (in pounds) that are collected from the machine each hour (y) . Also shown below are the outputs from two different statistical technologies (TI- 83/84 Calculator and Excel) . A scatterplot of the data confirms that there is a linear association. Report the equation for predicting scrap brass shavings using words such as scrap, not x and y. State the slope and intercept of the prediction equation. Round all calculations to the nearest thousandth. 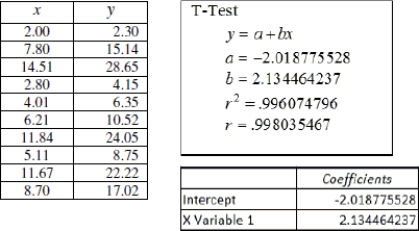
A) scrap = - 2.019 + 2.134(pressure) ; slope = - 2.019 and the intercept is 2.134.
B) scrap = 2.134 - 2.019(pressure) ; slope = - 2.019 and the intercept is 2.134.
C) scrap = - 2.019 + 2.134(pressure) ; slope = 2.134 and the intercept is - 2.019.
D) scrap = 2.134 - 2.019(pressure) ; slope = 2.134 and the intercept is - 2.019.
Correct Answer:
Verified
Q33: Use the following information to answer the
Q34: The following model was created to show
Q35: r = - 0.3526 Q36: The table shows the number of minutes Q37: Suppose it has been established that "home Q39: Use the following information to answer the Q40: Use the following information to answer the Q41: Use the data provided in the table Q42: The following regression equation was found to Q43: Explain in your own words what extrapolation
A) ![]()
Unlock this Answer For Free Now!
View this answer and more for free by performing one of the following actions

Scan the QR code to install the App and get 2 free unlocks

Unlock quizzes for free by uploading documents