Solve the problem.
-The data below represent the average monthly cost of natural gas in an Oregon home. 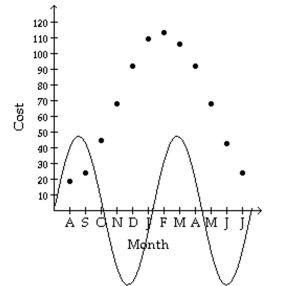 Above is the graph of ake a scatter diagram of the data. Find the sinusoidal function of the form which fits the data.
Correct Answer:
Verified
\[\begin{array} { c }
y = 4 ...
View Answer
Unlock this answer now
Get Access to more Verified Answers free of charge
Q356: Find the phase shift of the
Q357: Graph the function. Show at least
Q358: Graph the function. Show at least
Q359: Graph the function. Show at least
Q360: Find the phase shift of the
Q361: Solve the problem.
-The following data represents
Q362: Solve the problem.
-The data below represent
Q363: Solve the problem.
-The following data represents
Q364: Solve the problem.
-The following data represents
Q365: Solve the problem.
-The following data represents
Unlock this Answer For Free Now!
View this answer and more for free by performing one of the following actions

Scan the QR code to install the App and get 2 free unlocks

Unlock quizzes for free by uploading documents