The graph below is a residual plot for a set of regression data. Does the graph suggest violation of one or more of the assumptions for regression inferences? Explain your answer. 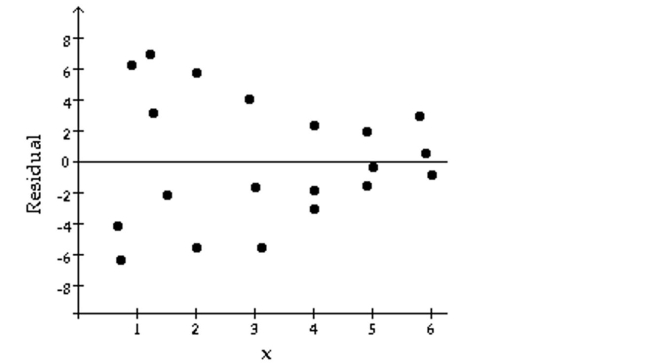
Correct Answer:
Verified
View Answer
Unlock this answer now
Get Access to more Verified Answers free of charge
Q30: Perform the required correlation test. You
Q31: Construct a residual plot for the
Q32: Perform the required correlation test. You may
Q33: A researcher is interested in the relationship
Q34: Construct a normal probability plot of
Q36: In a study of the relationship between
Q37: Paired sample data is given. Discuss
Q38: Paired sample data is given. Discuss
Q39: The graph below is a residual plot
Q40: Construct a normal probability plot of
Unlock this Answer For Free Now!
View this answer and more for free by performing one of the following actions

Scan the QR code to install the App and get 2 free unlocks

Unlock quizzes for free by uploading documents