Construct a residual plot for the given data.
-A grass seed company conducts a study to determine the relationship between the density of seeds planted (in pounds per 500 sq ft)and the quality of the resulting lawn. Eight similar plots of land are selected and each is planted with a particular density of seed. One month later the quality of each lawn is rated on a scale of 0 to 100. The sample data are given below, where x denotes seed density, and y denotes lawn quality. 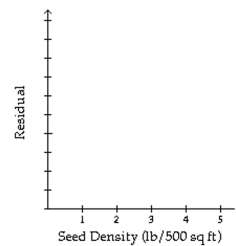
Correct Answer:
Verified
Q26: Decide, at the given significance level,
Q27: The sample data below are the
Q28: Construct a residual plot for the
Q29: When testing to determine if correlation
Q30: Perform the required correlation test. You
Q32: Perform the required correlation test. You may
Q33: A researcher is interested in the relationship
Q34: Construct a normal probability plot of
Q35: The graph below is a residual plot
Q36: In a study of the relationship between
Unlock this Answer For Free Now!
View this answer and more for free by performing one of the following actions

Scan the QR code to install the App and get 2 free unlocks

Unlock quizzes for free by uploading documents