Use the figure to answer the question.
-The data below give the figures for the United States production of canned fruit from 2002 to
2009. Make a line graph for the data. 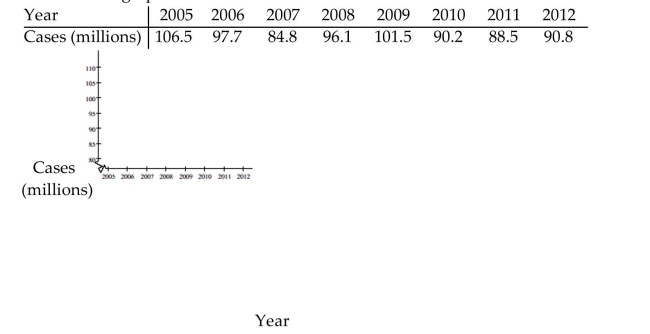
Correct Answer:
Verified
Q45: Identify whether the given scatterplot shows a
Q46: Construct the requested statistical display.
-The one-day temperatures
Q47: Use the circle graph to solve the
Q48: Identify whether the given scatterplot shows a
Q49: Identify whether the given scatterplot shows a
Q51: Use the figure to answer the question.
-The
Q52: Use the figure to answer the question.
-The
Q53: Use the circle graph to solve the
Q54: Use the figure to answer the question.
-The
Q55: Construct the requested statistical display.
-Kevin asked
Unlock this Answer For Free Now!
View this answer and more for free by performing one of the following actions

Scan the QR code to install the App and get 2 free unlocks

Unlock quizzes for free by uploading documents