Use the circle graph to solve the problem.
-In a school survey, students showed these preferences for instructional materials. 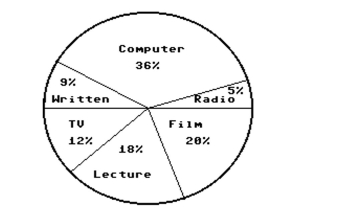 About how many students would you expect to prefer TV in a school of 500 students?
A) About 60 students
B) About 100 students
C) About 12 students
D) About 90 students
Correct Answer:
Verified
Q42: Identify whether the given scatterplot shows a
Q43: Use the figure to answer the question.
-The
Q44: Use the figure to answer the question.
-The
Q45: Identify whether the given scatterplot shows a
Q46: Construct the requested statistical display.
-The one-day temperatures
Q48: Identify whether the given scatterplot shows a
Q49: Identify whether the given scatterplot shows a
Q50: Use the figure to answer the question.
-The
Q51: Use the figure to answer the question.
-The
Q52: Use the figure to answer the question.
-The
Unlock this Answer For Free Now!
View this answer and more for free by performing one of the following actions

Scan the QR code to install the App and get 2 free unlocks

Unlock quizzes for free by uploading documents