Refer to the graph below. 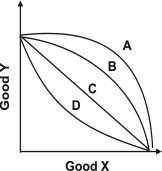 With which curve does the opportunity cost of an additional unit of good Y decrease as more units of good Y are produced?
A) A
B) B
C) C
D) D
Correct Answer:
Verified
Q27: If a production possibility curve representing a
Q30: Refer to the graph below. 
Q31: To graphically demonstrate the principle of increasing
Q32: Refer to the graph shown.Given the production
Q33: England has a relatively cool and cloudy
Q35: Refer to the graph below.
Q36: When you produce cars, it is enormously
Q37: Given the production possibility curve shown, the
Q38: The principle of increasing marginal opportunity cost
Q39: In the graph shown, what change would
Unlock this Answer For Free Now!
View this answer and more for free by performing one of the following actions

Scan the QR code to install the App and get 2 free unlocks

Unlock quizzes for free by uploading documents