Refer to the graph below. 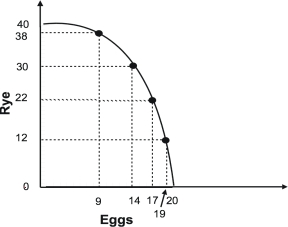 The graph indicates that as more eggs are produced, the marginal opportunity cost of:
A) both eggs and rye increases.
B) eggs increases while the marginal opportunity cost of rye remains constant.
C) eggs increases while the marginal opportunity cost of rye decreases.
D) eggs decreases while the marginal opportunity cost of rye remains constant.
Correct Answer:
Verified
Q30: Refer to the graph below. 
Q31: To graphically demonstrate the principle of increasing
Q32: Refer to the graph shown.Given the production
Q33: England has a relatively cool and cloudy
Q34: Refer to the graph below.
Q36: When you produce cars, it is enormously
Q37: Given the production possibility curve shown, the
Q38: The principle of increasing marginal opportunity cost
Q39: In the graph shown, what change would
Q40: This production possibility table illustrates:
Unlock this Answer For Free Now!
View this answer and more for free by performing one of the following actions

Scan the QR code to install the App and get 2 free unlocks

Unlock quizzes for free by uploading documents