A time series plot of a period of time (in weeks) versus sales (in 1,000's of gallons) is shown below. Which of the following data patterns best describes the scenario shown? 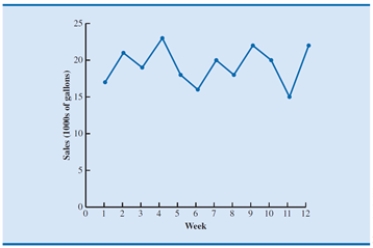
A) Time series with a linear trend pattern
B) Time series with a nonlinear trend pattern
C) Time series with no pattern
D) Time series with a horizontal pattern
Correct Answer:
Verified
Q2: Trend refers to
A)the long-run shift or movement
Q3: A time series plot of a period
Q4: A time series plot of a period
Q5: A time series plot of a period
Q6: With reference to time series data patterns,
Q7: An exponential trend pattern occurs when
A)the amount
Q8: _ is the amount by which the
Q9: A forecast is defined as a(n)
A)prediction of
Q10: Which is not true regarding trend patterns?
A)Can
Q11: If a time series plot exhibits a
Unlock this Answer For Free Now!
View this answer and more for free by performing one of the following actions

Scan the QR code to install the App and get 2 free unlocks

Unlock quizzes for free by uploading documents