Use the graphs to answer the following question.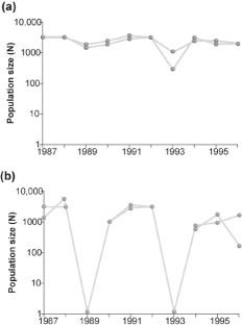
Graph (b) in the figure shows the normal fluctuations of a population of grouse, a ground-nesting bird. Assuming graph (a) in the figure is the result of some experimental treatment in the grouse population, what can be concluded?
A) The experimental treatment intensified the population cycling.
B) The experimental treatment did not affect population cycling in this species.
C) The experimental treatment has most likely identified the cause of population cycling.
D) The experimental treatment involved the introduction of a predator of the bird.
Correct Answer:
Verified
Q36: As N approaches K for a certain
Q37: A population of ground squirrels has an
Q38: Use the graph to answer the following
Q39: Use the graph to answer the following
Q40: Imagine that you are managing a large
Q42: Which of the following traits is characteristic
Q43: Often the growth cycle of one population
Q44: Which of the following graphs illustrates the
Q45: Use the graph to answer the following
Q46: Use the figure to answer the following
Unlock this Answer For Free Now!
View this answer and more for free by performing one of the following actions

Scan the QR code to install the App and get 2 free unlocks

Unlock quizzes for free by uploading documents