Use the graph to answer the following question.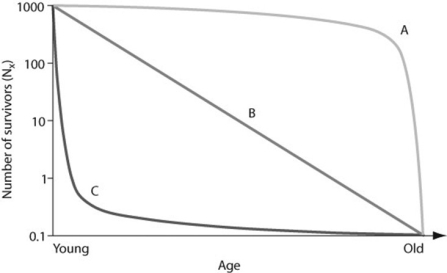
Which of the following examples are plausible explanations for a population that would produce curve A in the figure?
I.Ongoing predation of rabbits throughout their lives
II.Susceptibility of older humans to heart disease
III.High seedling mortality in sunflowers
A) I only
B) II only
C) I and II
D) II and III
Correct Answer:
Verified
Q33: During exponential growth, a population always _.
A)
Q34: Which of the following graphs illustrates the
Q35: Which of the following graphs best illustrates
Q36: As N approaches K for a certain
Q37: A population of ground squirrels has an
Q39: Use the graph to answer the following
Q40: Imagine that you are managing a large
Q41: Use the graphs to answer the following
Q42: Which of the following traits is characteristic
Q43: Often the growth cycle of one population
Unlock this Answer For Free Now!
View this answer and more for free by performing one of the following actions

Scan the QR code to install the App and get 2 free unlocks

Unlock quizzes for free by uploading documents