The following scatterplot represents the results of a study undertaken by Chakrabarty et al. (2005) who were investigating glutamate levels in psychotropic drug-naive OCD patients and comparing them with psychiatrically normal controls. Based on this scatterplot the following ANCOVA of glutamate levels in CSF was done. Findings were reported as follows for CSF glutamate levels in OCD patients compared to controls: F(1,29) =11.153, p=0.002. What conclusion can be drawn about this result? 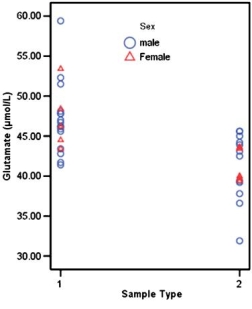 Scatterplot showing CSF glutamate levels in patients (1) and controls (2) . Source: http:/ / www.nature.com/ npp/ journal/ v30/ n9/ full/ 1300733a.html
ANCOVA of Glutamate Levels in CSF Diagnosis (OCD vs Controls) and gender were included as factors, while age, number of years of illness, total Y-BOCS scores, and CGI-S scores were included as covariates in the analysis.
Source: http:/ / www.nature.com/ npp/ journal/ v30/ n9/ full/ 1300733a.html
A) A significant main effect of gender is evident on CSF glutamate levels.
B) A significant main effect of age is evident on CSF glutamate levels.
C) A significant main effect of diagnosis is evident on CSF glutamate levels.
D) No significant effects are evident on CSF glutamate levels.
Correct Answer:
Verified
Q1: A health psychologist was interested in the
Q5: What is an alternative way to model
Q7: In an ANCOVA with one covariate and
Q15: What makes ANCOVA different from ANOVA?
A) ANCOVA
Q16: What is not true of the ANCOVA
Q18: Using the SPSS output below, which of
Q19: Consider the graph below. This is the
Q21: The following scatterplot represents the results of
Q21: When assumptions are violated in ANCOVA, which
Q23: What does the effect size measure in
Unlock this Answer For Free Now!
View this answer and more for free by performing one of the following actions

Scan the QR code to install the App and get 2 free unlocks

Unlock quizzes for free by uploading documents