Consider the graph below. This is the graph of the results of an experimental learning condition as the independent variable and IQ as the covariate. What does the graph indicate? 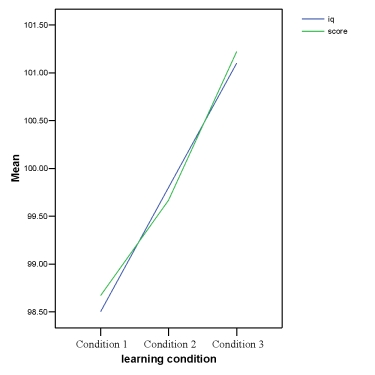
A) Although the independent variable has had an effect on the dependent variable, the covariate is the more likely explanation of effect.
B) The learning condition has altered IQ.
C) IQ has altered the learning condition.
D) Not enough information.
Correct Answer:
Verified
Q1: A health psychologist was interested in the
Q5: What is an alternative way to model
Q7: In an ANCOVA with one covariate and
Q15: What makes ANCOVA different from ANOVA?
A) ANCOVA
Q16: What is not true of the ANCOVA
Q18: Using the SPSS output below, which of
Q21: The following scatterplot represents the results of
Q21: When assumptions are violated in ANCOVA, which
Q22: The following scatterplot represents the results of
Q23: What does the effect size measure in
Unlock this Answer For Free Now!
View this answer and more for free by performing one of the following actions

Scan the QR code to install the App and get 2 free unlocks

Unlock quizzes for free by uploading documents