Use the information below to answer the following question. 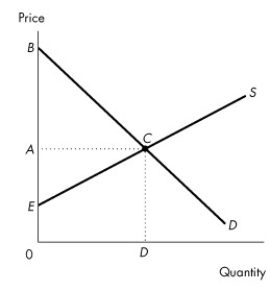 Figure 5.2.7
-Consider the demand and supply curves in Figure 5.2.7.If the market is at the competitive equilibrium,which area in the diagram indicates the cost of producing the quantity sold?
A) ABC
B) AEC
C) EBC
D) 0BCD
E) 0ECD
Correct Answer:
Verified
Q56: If a firm produces one more bottle
Q57: Use the figure below to answer the
Q58: Market demand is the
A)sum of the prices
Q59: The marginal cost of producing an additional
Q60: Marginal cost
A)is less than price.
B)can be negative.
C)is
Q62: Use the figure below to answer the
Q63: Use the table below to answer the
Q64: A market demand curve is constructed by
A)adding
Q65: Use the table below to answer the
Q66: In 2017,a severe drought led to an
Unlock this Answer For Free Now!
View this answer and more for free by performing one of the following actions

Scan the QR code to install the App and get 2 free unlocks

Unlock quizzes for free by uploading documents