Use the figure below to answer the following questions. 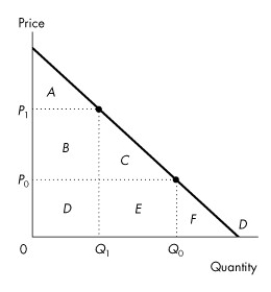 Figure 5.2.3
-Refer to Figure 5.2.3.If the price falls from P1 to P0,what area on the graph indicates the change in consumer surplus?
A) A
B) A plus B
C) A plus B plus C
D) B plus C
E) A plus B plus D
Correct Answer:
Verified
Q52: A market supply curve is
A)the horizontal sum
Q53: Use the figure below to answer the
Q54: Use the figure below to answer the
Q55: A supply curve is
A)the same as a
Q56: If a firm produces one more bottle
Q58: Market demand is the
A)sum of the prices
Q59: The marginal cost of producing an additional
Q60: Marginal cost
A)is less than price.
B)can be negative.
C)is
Q61: Use the information below to answer the
Q62: Use the figure below to answer the
Unlock this Answer For Free Now!
View this answer and more for free by performing one of the following actions

Scan the QR code to install the App and get 2 free unlocks

Unlock quizzes for free by uploading documents