Deck 12: Creating Graphics
ملء الشاشة (f)
سؤال
سؤال
سؤال
سؤال
سؤال
سؤال
سؤال
سؤال
سؤال
سؤال
سؤال
سؤال
سؤال
سؤال
سؤال
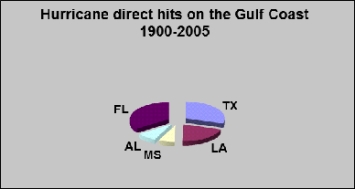
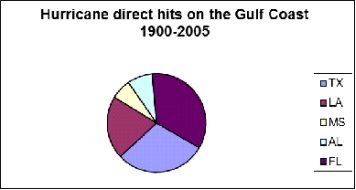
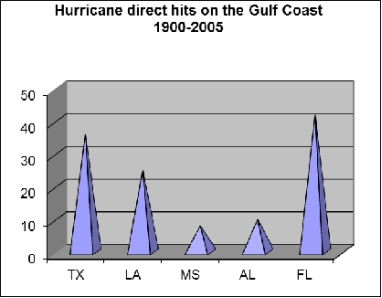
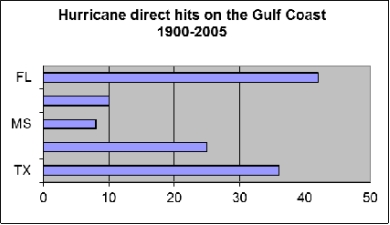
A technical writer wants to create a graphic showing the proportion of hurricanes that have hit each of the Gulf Coast states between 1900 and 2005. The graphic will be included in a safety brochure to be distributed to the public by the Federal Emergency Management Agency. Which graphic best displays these data?
A)
B)
C)
D)
A)
B)
C)
D)
سؤال
سؤال
سؤال
سؤال
سؤال
سؤال
سؤال
سؤال
سؤال
سؤال
سؤال
سؤال
سؤال
سؤال
سؤال
سؤال
سؤال
سؤال
سؤال
سؤال
سؤال
سؤال
سؤال
سؤال
سؤال

فتح الحزمة
قم بالتسجيل لفتح البطاقات في هذه المجموعة!
Unlock Deck
Unlock Deck
1/40
العب
ملء الشاشة (f)
Deck 12: Creating Graphics
1
Which of the following graphics would be best suited to showing the stages of a procedure or a process?
A) checklist
B) drawing
C) organization chart
D) flowchart
A) checklist
B) drawing
C) organization chart
D) flowchart
D
2
Which of the following is structured to emphasize the person or group with responsibility for certain tasks?
A) deployment flowchart
B) deployment organization chart
C) logic tree
D) diagram
A) deployment flowchart
B) deployment organization chart
C) logic tree
D) diagram
A
3
Which of the following graphics would be best suited to showing logical relationships?
A) table
B) checklist
C) line drawing
D) organization chart
A) table
B) checklist
C) line drawing
D) organization chart
D
4
Why is it important to use care in creating graphics for multicultural audiences?
A) Culture affects how people read images and what they see in them.
B) Differences between cultural interpretations of graphics tend to be slight.
C) Multicultural audiences are happy if at least a short caption for the image is in their native language.
D) All responses are correct.
A) Culture affects how people read images and what they see in them.
B) Differences between cultural interpretations of graphics tend to be slight.
C) Multicultural audiences are happy if at least a short caption for the image is in their native language.
D) All responses are correct.
فتح الحزمة
افتح القفل للوصول البطاقات البالغ عددها 40 في هذه المجموعة.
فتح الحزمة
k this deck
5
You work in the recruiting office of a large state university. You need to give your boss precise numerical data-including numbers of applicants, numbers of enrollees, percentages, and statistical measurements-about recruiting efforts in five different regions. Which type of graphic would best suit your needs?
A) bar graph
B) table
C) line graph
D) pictograph
A) bar graph
B) table
C) line graph
D) pictograph
فتح الحزمة
افتح القفل للوصول البطاقات البالغ عددها 40 في هذه المجموعة.
فتح الحزمة
k this deck
6
Which of these graphics would be effective for illustrating visual and spatial characteristics?
A) organization chart
B) screen shot
C) pictograph
D) table
A) organization chart
B) screen shot
C) pictograph
D) table
فتح الحزمة
افتح القفل للوصول البطاقات البالغ عددها 40 في هذه المجموعة.
فتح الحزمة
k this deck
7
A writer is creating a table that has 22 rows and 6 columns of data, all of which must appear on one page. To prevent readers from misinterpreting the data, which of the following techniques should the writer apply to the table?
A) drawing a horizontal rule after each row of data
B) using thick grid lines to help readers distinguish information in adjoining cells
C) grouping rows together in a logical order to help readers make comparisons
D) italicizing column heads
A) drawing a horizontal rule after each row of data
B) using thick grid lines to help readers distinguish information in adjoining cells
C) grouping rows together in a logical order to help readers make comparisons
D) italicizing column heads
فتح الحزمة
افتح القفل للوصول البطاقات البالغ عددها 40 في هذه المجموعة.
فتح الحزمة
k this deck
8
A writing team has the six-month sales figures for its company's 14 sales representatives. Because managers must make comparative analyses, the graphic for these data must group representatives by region, as well as show each representative's monthly sales total. Which is the best graphic for displaying this information?
A) table
B) logic tree
C) organization chart
D) bar graph
A) table
B) logic tree
C) organization chart
D) bar graph
فتح الحزمة
افتح القفل للوصول البطاقات البالغ عددها 40 في هذه المجموعة.
فتح الحزمة
k this deck
9
What does copyright law have to do with graphics?
A) Copyright determines who may modify a graphic.
B) Copyright determines who has the ability to read a graphic.
C) Copyright determines who has the right to publish or republish a graphic.
D) Copyright determines the medium of a graphic.
A) Copyright determines who may modify a graphic.
B) Copyright determines who has the ability to read a graphic.
C) Copyright determines who has the right to publish or republish a graphic.
D) Copyright determines the medium of a graphic.
فتح الحزمة
افتح القفل للوصول البطاقات البالغ عددها 40 في هذه المجموعة.
فتح الحزمة
k this deck
10
You are making a graphic for automotive technicians that illustrates the procedure for performing a computerized vehicle inspection. Which of the following is the best graphic for displaying this information?
A) organization chart
B) drawing
C) flowchart
D) diagram
A) organization chart
B) drawing
C) flowchart
D) diagram
فتح الحزمة
افتح القفل للوصول البطاقات البالغ عددها 40 في هذه المجموعة.
فتح الحزمة
k this deck
11
Which type of graphic does NOT use metaphor to convey information?
A) flowchart
B) photograph
C) diagram
D) organization chart
A) flowchart
B) photograph
C) diagram
D) organization chart
فتح الحزمة
افتح القفل للوصول البطاقات البالغ عددها 40 في هذه المجموعة.
فتح الحزمة
k this deck
12
Chapter 12 identifies four stages in the process of creating graphics. Which of the following is NOT mentioned in the chapter?
A) trademarking
B) planning
C) revising
D) producing
A) trademarking
B) planning
C) revising
D) producing
فتح الحزمة
افتح القفل للوصول البطاقات البالغ عددها 40 في هذه المجموعة.
فتح الحزمة
k this deck
13
You are writing a report on the two candidates competing to represent your district in the U.S. House of Representatives. You create a pie chart for each candidate to show where the candidate's campaign money comes from. You use purple for small individual donations, orange for large individual donations, blue for corporate donations, yellow for political action committee (PAC) contributions, red for political-party donations, and gray for other money. Which principle of using color effectively have you followed?
A) using color to create contrast between the text and the background
B) using color to emphasize particular items
C) using symbolic meanings of colors
D) using color to create patterns
A) using color to create contrast between the text and the background
B) using color to emphasize particular items
C) using symbolic meanings of colors
D) using color to create patterns
فتح الحزمة
افتح القفل للوصول البطاقات البالغ عددها 40 في هذه المجموعة.
فتح الحزمة
k this deck
14
Chapter 12 suggests that you consider four factors when planning a graphic. One is your audience. What else should you consider?
A) the physical conditions in which readers will view the graphic
B) the kind of information you want to communicate
C) your purpose
D) All responses are correct.
E) None of the responses are correct.
A) the physical conditions in which readers will view the graphic
B) the kind of information you want to communicate
C) your purpose
D) All responses are correct.
E) None of the responses are correct.
فتح الحزمة
افتح القفل للوصول البطاقات البالغ عددها 40 في هذه المجموعة.
فتح الحزمة
k this deck
15
A technical writer wants to create a graphic showing the proportion of hurricanes that have hit each of the Gulf Coast states between 1900 and 2005. The graphic will be included in a safety brochure to be distributed to the public by the Federal Emergency Management Agency. Which graphic best displays these data?
A)
B)
C)
D)
A)
B)
C)
D)
فتح الحزمة
افتح القفل للوصول البطاقات البالغ عددها 40 في هذه المجموعة.
فتح الحزمة
k this deck
16
Chapter 12 offers six principles for using color in graphics. One is "Don't overdo it." Which of the following principles is also mentioned in the chapter?
A) Use color to create patterns.
B) Use as many colors as possible.
C) Use dark colors to make objects look smaller.
D) All responses are correct.
A) Use color to create patterns.
B) Use as many colors as possible.
C) Use dark colors to make objects look smaller.
D) All responses are correct.
فتح الحزمة
افتح القفل للوصول البطاقات البالغ عددها 40 في هذه المجموعة.
فتح الحزمة
k this deck
17
Why might you include a common, familiar item in a photograph of an item being discussed?
A) to give readers a sense of scale
B) to eliminate background clutter
C) to prevent manipulation of the photograph
D) to save space in your document
A) to give readers a sense of scale
B) to eliminate background clutter
C) to prevent manipulation of the photograph
D) to save space in your document
فتح الحزمة
افتح القفل للوصول البطاقات البالغ عددها 40 في هذه المجموعة.
فتح الحزمة
k this deck
18
How can a writer avoid creating chartjunk?
A) by separating clip art from charts and graphs
B) by choosing two-dimensional charts and graphs over three-dimensional ones
C) by placing charts on pages separate from graphs
D) None of the responses are correct.
A) by separating clip art from charts and graphs
B) by choosing two-dimensional charts and graphs over three-dimensional ones
C) by placing charts on pages separate from graphs
D) None of the responses are correct.
فتح الحزمة
افتح القفل للوصول البطاقات البالغ عددها 40 في هذه المجموعة.
فتح الحزمة
k this deck
19
why do you need to cite the source of a graphic?
A) It is part of your ethical responsibilities.
B) It is necessary for papers submitted to industry conventions and conferences.
C) It increases the prestige of your bibliography.
D) None of the responses are correct.
A) It is part of your ethical responsibilities.
B) It is necessary for papers submitted to industry conventions and conferences.
C) It increases the prestige of your bibliography.
D) None of the responses are correct.
فتح الحزمة
افتح القفل للوصول البطاقات البالغ عددها 40 في هذه المجموعة.
فتح الحزمة
k this deck
20
Which of the following graphics would be best suited for showing the relative size of parts that make up a whole?
A) photograph
B) table
C) pie chart
D) flowchart
E) organization chart
A) photograph
B) table
C) pie chart
D) flowchart
E) organization chart
فتح الحزمة
افتح القفل للوصول البطاقات البالغ عددها 40 في هذه المجموعة.
فتح الحزمة
k this deck
21
Chapter 12 suggests that you consider four factors when planning a graphic. One is audience. Name two other factors you should consider.
فتح الحزمة
افتح القفل للوصول البطاقات البالغ عددها 40 في هذه المجموعة.
فتح الحزمة
k this deck
22
what is the most important characteristic of an infographic?
فتح الحزمة
افتح القفل للوصول البطاقات البالغ عددها 40 في هذه المجموعة.
فتح الحزمة
k this deck
23
one way to create graphics is to modify existing graphics.
فتح الحزمة
افتح القفل للوصول البطاقات البالغ عددها 40 في هذه المجموعة.
فتح الحزمة
k this deck
24
Saving space is not an ideal reason for cropping a photo to be used in technical communication. What is a better reason?
فتح الحزمة
افتح القفل للوصول البطاقات البالغ عددها 40 في هذه المجموعة.
فتح الحزمة
k this deck
25
A screen shot is a graphic showing what appears on a computer monitor.
فتح الحزمة
افتح القفل للوصول البطاقات البالغ عددها 40 في هذه المجموعة.
فتح الحزمة
k this deck
26
To achieve the most effective contrast between colors, pair dark and light shades of a deep color together.
فتح الحزمة
افتح القفل للوصول البطاقات البالغ عددها 40 في هذه المجموعة.
فتح الحزمة
k this deck
27
If a graphic is on the Internet, you may assume that you are free to republish it.
فتح الحزمة
افتح القفل للوصول البطاقات البالغ عددها 40 في هذه المجموعة.
فتح الحزمة
k this deck
28
Many Western hand gestures, such as the "okay" sign, are considered obscene in other cultures.
فتح الحزمة
افتح القفل للوصول البطاقات البالغ عددها 40 في هذه المجموعة.
فتح الحزمة
k this deck
29
Why is it important to either begin graph axes at zero or mark them clearly?
فتح الحزمة
افتح القفل للوصول البطاقات البالغ عددها 40 في هذه المجموعة.
فتح الحزمة
k this deck
30
Chapter 12 offers six guidelines for using color in graphics. One is to use contrast effectively. Name two other guidelines mentioned in the chapter.
فتح الحزمة
افتح القفل للوصول البطاقات البالغ عددها 40 في هذه المجموعة.
فتح الحزمة
k this deck
31
In a table, the stub is the right-hand column.
فتح الحزمة
افتح القفل للوصول البطاقات البالغ عددها 40 في هذه المجموعة.
فتح الحزمة
k this deck
32
If you want to publish a graphic that your organization paid to have produced, you do not need written permission.
فتح الحزمة
افتح القفل للوصول البطاقات البالغ عددها 40 في هذه المجموعة.
فتح الحزمة
k this deck
33
one potential drawback of photographs is that they can provide too much information.
فتح الحزمة
افتح القفل للوصول البطاقات البالغ عددها 40 في هذه المجموعة.
فتح الحزمة
k this deck
34
graphics are important in technical communication because they can help you communicate information that is difficult to communicate in words. What is another reason graphics are important?
فتح الحزمة
افتح القفل للوصول البطاقات البالغ عددها 40 في هذه المجموعة.
فتح الحزمة
k this deck
35
Chapter 12 discusses five principles for making a graphic clear and understandable. One principle is that the graphic should have a purpose. What is another principle for making an effective graphic?
فتح الحزمة
افتح القفل للوصول البطاقات البالغ عددها 40 في هذه المجموعة.
فتح الحزمة
k this deck
36
Besides using existing graphics, what is one other approach to producing graphics, according to Chapter 12?
فتح الحزمة
افتح القفل للوصول البطاقات البالغ عددها 40 في هذه المجموعة.
فتح الحزمة
k this deck
37
Graphics typically increase the costs of translating documents intended for international readers.
فتح الحزمة
افتح القفل للوصول البطاقات البالغ عددها 40 في هذه المجموعة.
فتح الحزمة
k this deck
38
Chapter 12 provides seven guidelines for creating effective infographics. One is "Don't go on forever." Name two other guidelines mentioned in the chapter.
فتح الحزمة
افتح القفل للوصول البطاقات البالغ عددها 40 في هذه المجموعة.
فتح الحزمة
k this deck
39
Where is the stub located in a table?
فتح الحزمة
افتح القفل للوصول البطاقات البالغ عددها 40 في هذه المجموعة.
فتح الحزمة
k this deck
40
Chapter 12 discusses five characteristics that make a graphic clear and understandable. One characteristic is that the graphic meets readers' format expectations.
فتح الحزمة
افتح القفل للوصول البطاقات البالغ عددها 40 في هذه المجموعة.
فتح الحزمة
k this deck
فتح الحزمة
افتح القفل للوصول البطاقات البالغ عددها 40 في هذه المجموعة.


